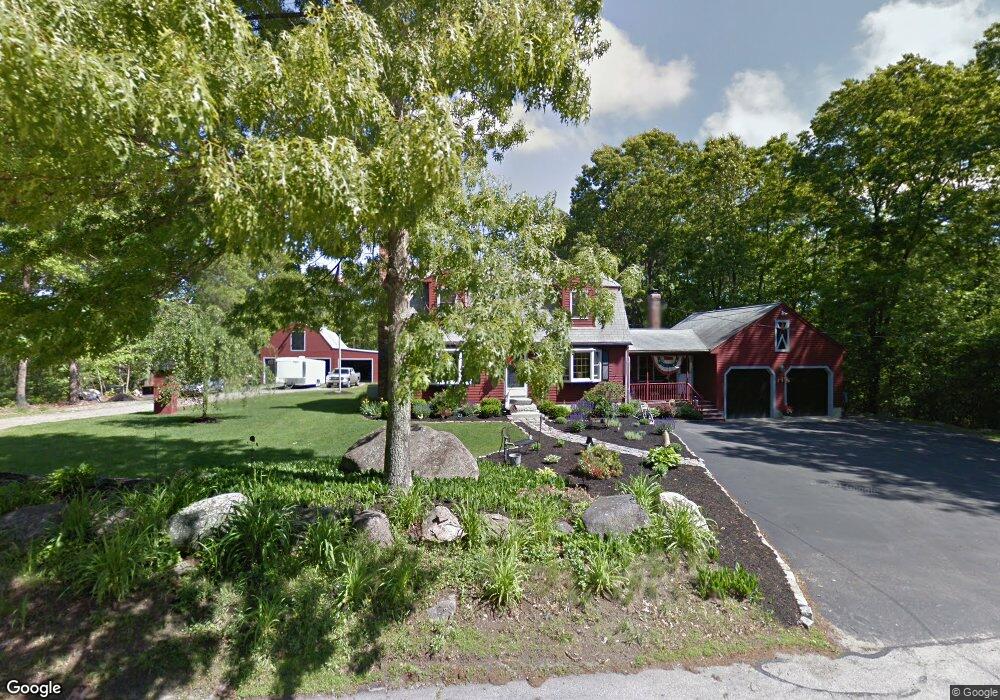
61 Harkness Rd Millville, MA 01529
Estimated Value: $577,463 - $601,000
3
Beds
3
Baths
1,973
Sq Ft
$297/Sq Ft
Est. Value
About This Home
This home is located at 61 Harkness Rd, Millville, MA 01529 and is currently estimated at $586,866, approximately $297 per square foot. 61 Harkness Rd is a home located in Worcester County with nearby schools including Blackstone-Millville Regional High School.
Ownership History
Date
Name
Owned For
Owner Type
Purchase Details
Closed on
Mar 30, 1987
Sold by
Cormier Jean M
Bought by
Poulin F M
Current Estimated Value
Home Financials for this Owner
Home Financials are based on the most recent Mortgage that was taken out on this home.
Original Mortgage
$45,000
Interest Rate
9.03%
Mortgage Type
Purchase Money Mortgage
Create a Home Valuation Report for This Property
The Home Valuation Report is an in-depth analysis detailing your home's value as well as a comparison with similar homes in the area
Home Values in the Area
Average Home Value in this Area
Purchase History
| Date | Buyer | Sale Price | Title Company |
|---|---|---|---|
| Poulin F M | $144,000 | -- |
Source: Public Records
Mortgage History
| Date | Status | Borrower | Loan Amount |
|---|---|---|---|
| Open | Poulin F M | $70,000 | |
| Closed | Poulin F M | $40,000 | |
| Closed | Poulin F M | $45,000 |
Source: Public Records
Tax History
| Year | Tax Paid | Tax Assessment Tax Assessment Total Assessment is a certain percentage of the fair market value that is determined by local assessors to be the total taxable value of land and additions on the property. | Land | Improvement |
|---|---|---|---|---|
| 2025 | $5,363 | $406,600 | $94,600 | $312,000 |
| 2024 | $6,483 | $490,400 | $67,600 | $422,800 |
| 2023 | $6,403 | $461,000 | $67,600 | $393,400 |
| 2022 | $6,144 | $406,600 | $94,600 | $312,000 |
| 2021 | $5,792 | $363,600 | $94,600 | $269,000 |
| 2020 | $5,126 | $319,000 | $91,600 | $227,400 |
| 2019 | $3,672 | $227,200 | $1,600 | $225,600 |
| 2018 | $5,190 | $313,400 | $116,100 | $197,300 |
| 2017 | $5,073 | $314,900 | $116,100 | $198,800 |
| 2016 | $5,188 | $306,800 | $116,100 | $190,700 |
| 2015 | $4,660 | $270,300 | $107,100 | $163,200 |
| 2014 | $4,577 | $266,400 | $104,100 | $162,300 |
Source: Public Records
Map
Nearby Homes
- 50 Main St
- 0 Buxton St Unit 1386233
- 0 Main St
- 1003 Victory Hwy
- 111 Cider Mill Rd
- 1 Tupperware Dr Unit 221
- 1 Tupperware Dr Unit 138
- 1 Tupperware Dr Unit 326
- 1 Tupperware Dr Unit 241
- 81 Thayer St
- 284 Lincoln St
- 122 Canal St
- 12 Silver Pines Blvd Unit 12
- 90 Chestnut Hill Rd
- 0 Mendon Rd Unit 1406977
- 26 Prospect St
- 13 Dawes St
- 29 Cork Cir Unit F
- 170 Providence Pike Unit 7
- 179 Thayer St
Your Personal Tour Guide
Ask me questions while you tour the home.