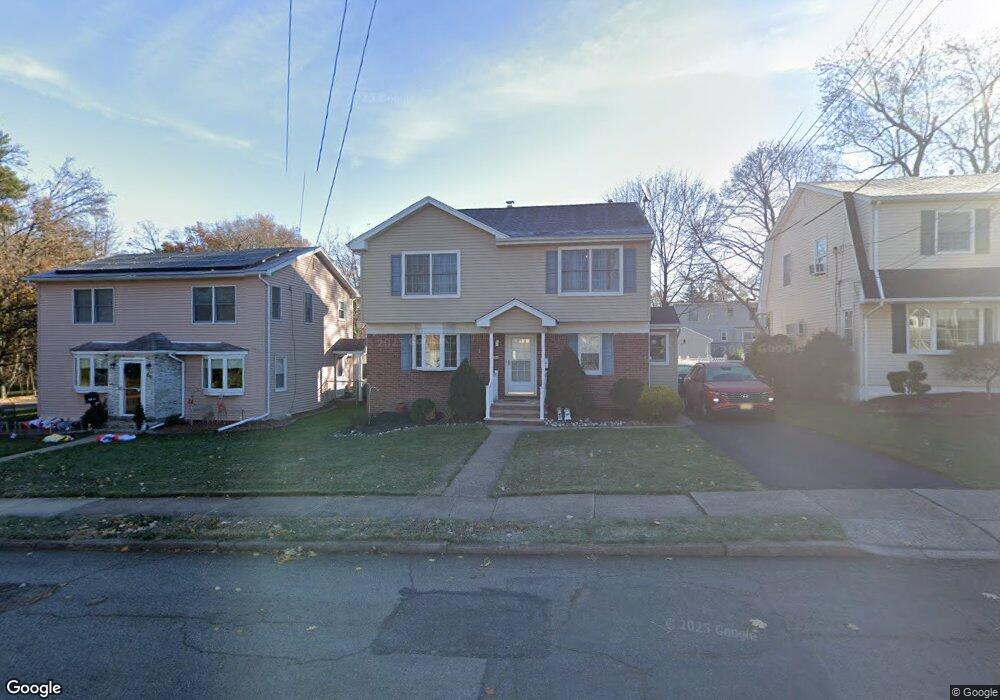
61 Harwick Rd Dumont, NJ 07628
Estimated Value: $632,608 - $759,000
--
Bed
--
Bath
1,664
Sq Ft
$419/Sq Ft
Est. Value
About This Home
This home is located at 61 Harwick Rd, Dumont, NJ 07628 and is currently estimated at $697,402, approximately $419 per square foot. 61 Harwick Rd is a home located in Bergen County with nearby schools including Dumont High School.
Ownership History
Date
Name
Owned For
Owner Type
Purchase Details
Closed on
Feb 12, 1998
Sold by
Potter Rita
Bought by
Conlan Neil B and Conlan Lisa M
Current Estimated Value
Home Financials for this Owner
Home Financials are based on the most recent Mortgage that was taken out on this home.
Original Mortgage
$135,000
Outstanding Balance
$15,307
Interest Rate
6.9%
Estimated Equity
$682,095
Create a Home Valuation Report for This Property
The Home Valuation Report is an in-depth analysis detailing your home's value as well as a comparison with similar homes in the area
Home Values in the Area
Average Home Value in this Area
Purchase History
| Date | Buyer | Sale Price | Title Company |
|---|---|---|---|
| Conlan Neil B | $153,500 | -- |
Source: Public Records
Mortgage History
| Date | Status | Borrower | Loan Amount |
|---|---|---|---|
| Open | Conlan Neil B | $135,000 |
Source: Public Records
Tax History Compared to Growth
Tax History
| Year | Tax Paid | Tax Assessment Tax Assessment Total Assessment is a certain percentage of the fair market value that is determined by local assessors to be the total taxable value of land and additions on the property. | Land | Improvement |
|---|---|---|---|---|
| 2025 | $12,719 | $568,700 | $308,000 | $260,700 |
| 2024 | $12,406 | $312,900 | $157,500 | $155,400 |
| 2023 | $12,150 | $312,900 | $157,500 | $155,400 |
| 2022 | $12,150 | $312,900 | $157,500 | $155,400 |
| 2021 | $12,090 | $312,900 | $157,500 | $155,400 |
| 2020 | $11,762 | $312,900 | $157,500 | $155,400 |
| 2019 | $11,480 | $312,900 | $157,500 | $155,400 |
| 2018 | $11,246 | $312,900 | $157,500 | $155,400 |
| 2017 | $11,030 | $312,900 | $157,500 | $155,400 |
| 2016 | $10,773 | $312,900 | $157,500 | $155,400 |
| 2015 | $10,526 | $312,900 | $157,500 | $155,400 |
| 2014 | $10,319 | $312,900 | $157,500 | $155,400 |
Source: Public Records
Map
Nearby Homes