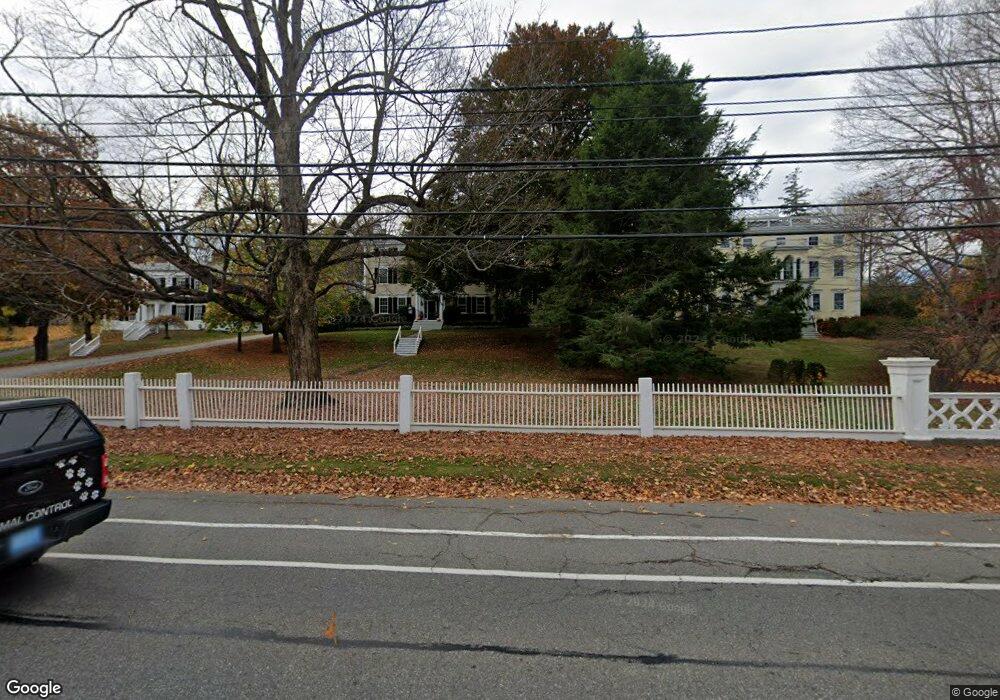
61 High St Newburyport, MA 01950
Estimated Value: $2,437,000 - $2,999,025
5
Beds
5
Baths
7,120
Sq Ft
$382/Sq Ft
Est. Value
About This Home
This home is located at 61 High St, Newburyport, MA 01950 and is currently estimated at $2,719,256, approximately $381 per square foot. 61 High St is a home located in Essex County with nearby schools including Francis T. Bresnahan Elementary School, Edward G. Molin Elementary School, and Rupert A. Nock Middle School.
Ownership History
Date
Name
Owned For
Owner Type
Purchase Details
Closed on
Jan 5, 2004
Sold by
Budd-Purinton Elizabeth and Purinton Spencer L
Bought by
Purinton Tr Spencer L
Current Estimated Value
Purchase Details
Closed on
Nov 24, 1993
Sold by
Crownshield Martha and Glidden Geoge
Bought by
Purinton Elizabeth and Purinton Spencer
Home Financials for this Owner
Home Financials are based on the most recent Mortgage that was taken out on this home.
Original Mortgage
$259,850
Interest Rate
6.72%
Mortgage Type
Purchase Money Mortgage
Create a Home Valuation Report for This Property
The Home Valuation Report is an in-depth analysis detailing your home's value as well as a comparison with similar homes in the area
Home Values in the Area
Average Home Value in this Area
Purchase History
| Date | Buyer | Sale Price | Title Company |
|---|---|---|---|
| Purinton Tr Spencer L | -- | -- | |
| Purinton Elizabeth | $490,000 | -- |
Source: Public Records
Mortgage History
| Date | Status | Borrower | Loan Amount |
|---|---|---|---|
| Previous Owner | Purinton Elizabeth | $226,000 | |
| Previous Owner | Purinton Elizabeth | $259,850 | |
| Previous Owner | Purinton Elizabeth | $259,850 | |
| Previous Owner | Purinton Elizabeth | $425,000 |
Source: Public Records
Tax History Compared to Growth
Tax History
| Year | Tax Paid | Tax Assessment Tax Assessment Total Assessment is a certain percentage of the fair market value that is determined by local assessors to be the total taxable value of land and additions on the property. | Land | Improvement |
|---|---|---|---|---|
| 2025 | $25,447 | $2,656,300 | $533,400 | $2,122,900 |
| 2024 | $23,830 | $2,390,200 | $486,100 | $1,904,100 |
| 2023 | $23,983 | $2,233,100 | $422,800 | $1,810,300 |
| 2022 | $25,546 | $2,127,100 | $354,300 | $1,772,800 |
| 2021 | $23,562 | $1,864,100 | $323,300 | $1,540,800 |
| 2020 | $22,180 | $1,727,400 | $323,300 | $1,404,100 |
| 2019 | $22,594 | $1,727,400 | $323,300 | $1,404,100 |
| 2018 | $21,847 | $1,647,600 | $308,600 | $1,339,000 |
| 2017 | $19,714 | $1,465,700 | $294,000 | $1,171,700 |
| 2016 | $19,312 | $1,442,300 | $279,900 | $1,162,400 |
| 2015 | $18,194 | $1,363,900 | $279,900 | $1,084,000 |
Source: Public Records
Map
Nearby Homes
- 78 High St
- 12 Parsons St Unit 2
- 7 Parsons St
- 113 Prospect St Unit B
- 111 Prospect St Unit A
- 58 Lime St Unit 5
- 95 High St Unit 4
- 141 State St Unit 2
- 65 Bromfield St
- 11 Orange St Unit 1
- 9 Orange St Unit 1
- 9 Orange St
- 4 School St
- 14 Spring St
- 42 Federal St Unit B
- 15 Beck St Unit 1
- 15 Beck St
- 5 High Rd
- 11 High Rd
- 14 Dalton St