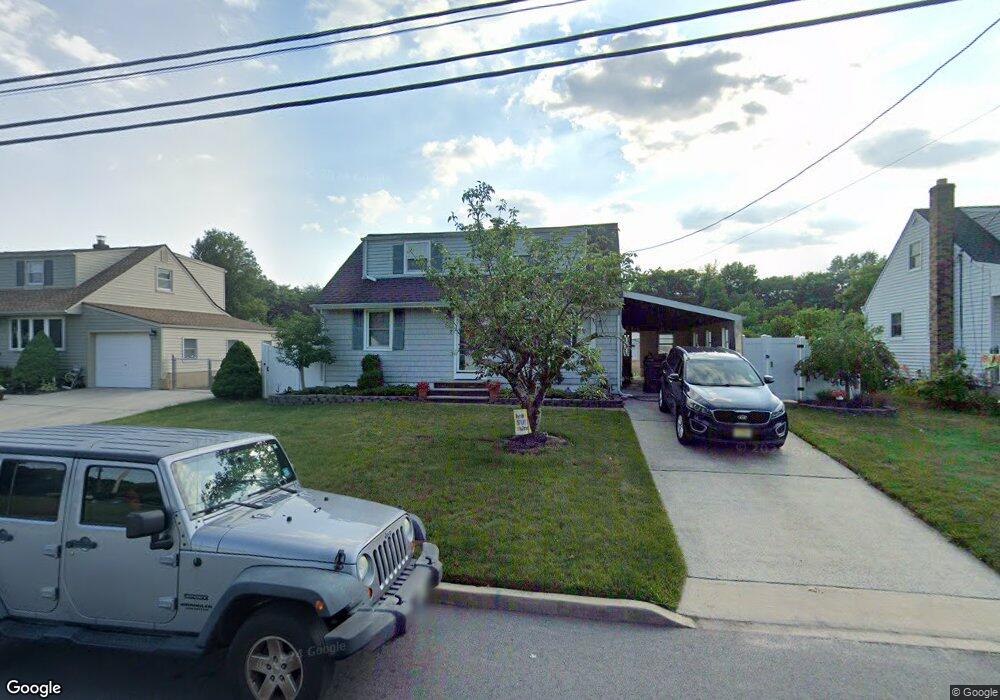
61 Hilliard Rd Old Bridge, NJ 08857
Estimated Value: $514,000 - $556,000
3
Beds
2
Baths
1,220
Sq Ft
$437/Sq Ft
Est. Value
About This Home
This home is located at 61 Hilliard Rd, Old Bridge, NJ 08857 and is currently estimated at $532,560, approximately $436 per square foot. 61 Hilliard Rd is a home located in Middlesex County with nearby schools including Old Bridge High School, St. Thomas the Apostle School, and Immaculate Conception School.
Ownership History
Date
Name
Owned For
Owner Type
Purchase Details
Closed on
Aug 16, 2016
Sold by
Young Robert J and Florek Laura M
Bought by
Young Robert J and Young Laura M
Current Estimated Value
Home Financials for this Owner
Home Financials are based on the most recent Mortgage that was taken out on this home.
Original Mortgage
$271,846
Outstanding Balance
$217,876
Interest Rate
3.62%
Mortgage Type
FHA
Estimated Equity
$314,684
Purchase Details
Closed on
Apr 27, 2007
Sold by
Nami Dennis
Bought by
Young Robert and Florek Laura
Home Financials for this Owner
Home Financials are based on the most recent Mortgage that was taken out on this home.
Original Mortgage
$319,950
Interest Rate
6.23%
Mortgage Type
FHA
Purchase Details
Closed on
Mar 11, 2006
Sold by
Bruno John
Bought by
Nami Dennis
Home Financials for this Owner
Home Financials are based on the most recent Mortgage that was taken out on this home.
Original Mortgage
$216,800
Interest Rate
6.28%
Create a Home Valuation Report for This Property
The Home Valuation Report is an in-depth analysis detailing your home's value as well as a comparison with similar homes in the area
Home Values in the Area
Average Home Value in this Area
Purchase History
| Date | Buyer | Sale Price | Title Company |
|---|---|---|---|
| Young Robert J | -- | Max Title | |
| Young Robert | $325,000 | -- | |
| Nami Dennis | $271,000 | -- |
Source: Public Records
Mortgage History
| Date | Status | Borrower | Loan Amount |
|---|---|---|---|
| Open | Young Robert J | $271,846 | |
| Closed | Young Robert | $319,950 | |
| Previous Owner | Nami Dennis | $216,800 |
Source: Public Records
Tax History Compared to Growth
Tax History
| Year | Tax Paid | Tax Assessment Tax Assessment Total Assessment is a certain percentage of the fair market value that is determined by local assessors to be the total taxable value of land and additions on the property. | Land | Improvement |
|---|---|---|---|---|
| 2025 | $6,714 | $118,900 | $44,900 | $74,000 |
| 2024 | $6,441 | $118,900 | $44,900 | $74,000 |
| 2023 | $6,441 | $118,900 | $44,900 | $74,000 |
| 2022 | $6,293 | $118,900 | $44,900 | $74,000 |
| 2021 | $4,619 | $118,900 | $44,900 | $74,000 |
| 2020 | $6,108 | $118,900 | $44,900 | $74,000 |
| 2019 | $6,004 | $118,900 | $44,900 | $74,000 |
| 2018 | $5,938 | $118,900 | $44,900 | $74,000 |
| 2017 | $5,745 | $118,900 | $44,900 | $74,000 |
| 2016 | $5,626 | $118,900 | $44,900 | $74,000 |
| 2015 | $5,529 | $118,900 | $44,900 | $74,000 |
| 2014 | $5,473 | $118,900 | $44,900 | $74,000 |
Source: Public Records
Map
Nearby Homes