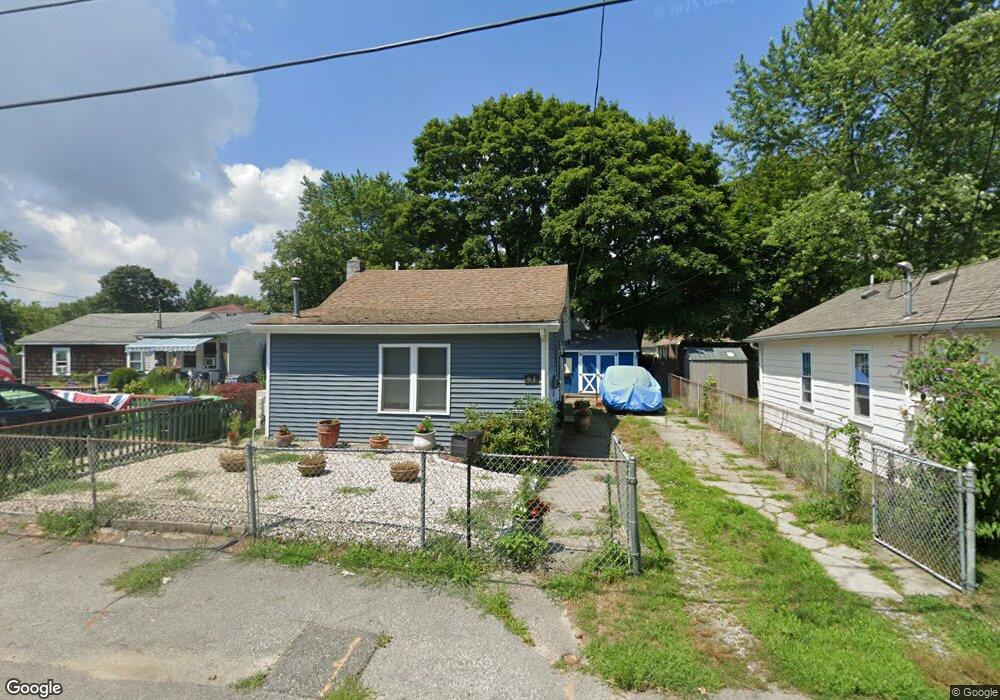
61 Huron St Warwick, RI 02889
Oakland Beach NeighborhoodEstimated Value: $261,000 - $304,000
2
Beds
1
Bath
565
Sq Ft
$497/Sq Ft
Est. Value
About This Home
This home is located at 61 Huron St, Warwick, RI 02889 and is currently estimated at $280,658, approximately $496 per square foot. 61 Huron St is a home located in Kent County with nearby schools including Saint Kevin School and Bishop Hendricken High School.
Ownership History
Date
Name
Owned For
Owner Type
Purchase Details
Closed on
Aug 17, 2021
Sold by
Marr Roger T
Bought by
Pacesetter Properties Llc
Current Estimated Value
Purchase Details
Closed on
Jan 23, 2021
Sold by
Pacesetter Properties Llc
Bought by
Ewans Fred
Purchase Details
Closed on
May 2, 2014
Sold by
Dolores Marr Ret and Marr
Bought by
Marr Roger T
Purchase Details
Closed on
May 23, 2011
Sold by
Marr Dolores
Bought by
Dolores Marr Rt
Purchase Details
Closed on
Jan 31, 1994
Sold by
Ge Capital Asset Mgmt
Bought by
Marr Dolores
Create a Home Valuation Report for This Property
The Home Valuation Report is an in-depth analysis detailing your home's value as well as a comparison with similar homes in the area
Home Values in the Area
Average Home Value in this Area
Purchase History
| Date | Buyer | Sale Price | Title Company |
|---|---|---|---|
| Pacesetter Properties Llc | $108,000 | None Available | |
| Ewans Fred | $167,500 | None Available | |
| Marr Roger T | -- | -- | |
| Dolores Marr Rt | -- | -- | |
| Marr Dolores | $14,500 | -- |
Source: Public Records
Tax History Compared to Growth
Tax History
| Year | Tax Paid | Tax Assessment Tax Assessment Total Assessment is a certain percentage of the fair market value that is determined by local assessors to be the total taxable value of land and additions on the property. | Land | Improvement |
|---|---|---|---|---|
| 2025 | $3,014 | $237,300 | $92,400 | $144,900 |
| 2024 | $2,689 | $185,800 | $74,600 | $111,200 |
| 2023 | $2,637 | $185,800 | $74,600 | $111,200 |
| 2022 | $2,412 | $128,800 | $44,800 | $84,000 |
| 2021 | $2,412 | $128,800 | $44,800 | $84,000 |
| 2020 | $2,412 | $128,800 | $44,800 | $84,000 |
| 2019 | $2,412 | $128,800 | $44,800 | $84,000 |
| 2018 | $1,751 | $86,500 | $41,600 | $44,900 |
| 2017 | $1,751 | $86,500 | $41,600 | $44,900 |
| 2016 | $1,751 | $86,500 | $41,600 | $44,900 |
| 2015 | $1,863 | $89,800 | $46,400 | $43,400 |
| 2014 | $1,801 | $89,800 | $46,400 | $43,400 |
| 2013 | $1,777 | $89,800 | $46,400 | $43,400 |
Source: Public Records
Map
Nearby Homes