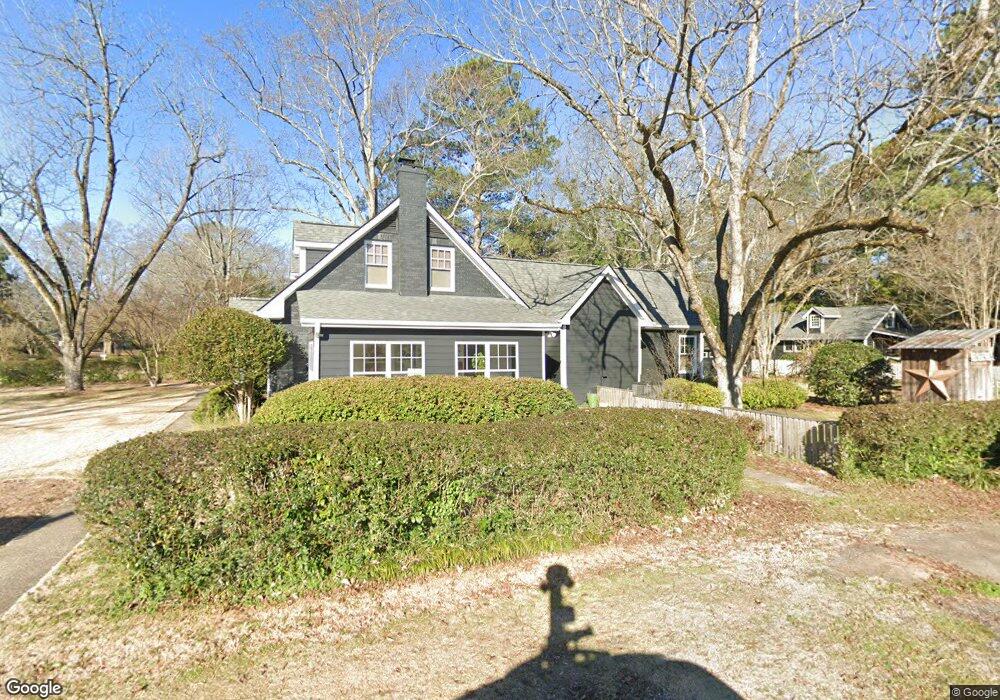
61 Jackson St Watkinsville, GA 30677
Estimated Value: $698,820 - $982,000
4
Beds
3
Baths
2,508
Sq Ft
$328/Sq Ft
Est. Value
About This Home
This home is located at 61 Jackson St, Watkinsville, GA 30677 and is currently estimated at $823,455, approximately $328 per square foot. 61 Jackson St is a home located in Oconee County with nearby schools including Colham Ferry Elementary School, Oconee County Middle School, and Oconee County High School.
Ownership History
Date
Name
Owned For
Owner Type
Purchase Details
Closed on
Aug 31, 2012
Sold by
Jenkins Amanda D
Bought by
Kirsche Kevin M and Kirsche Jacqueline F
Current Estimated Value
Home Financials for this Owner
Home Financials are based on the most recent Mortgage that was taken out on this home.
Original Mortgage
$285,000
Outstanding Balance
$197,301
Interest Rate
3.58%
Mortgage Type
New Conventional
Estimated Equity
$626,154
Purchase Details
Closed on
Dec 27, 2010
Sold by
Jenkins John Taylor
Bought by
Jenkins Amanda D
Home Financials for this Owner
Home Financials are based on the most recent Mortgage that was taken out on this home.
Original Mortgage
$211,000
Interest Rate
4.4%
Mortgage Type
New Conventional
Purchase Details
Closed on
Mar 28, 2002
Sold by
Dean Gary L
Bought by
Jenkins John Taylor and Jenkins Amanda D
Purchase Details
Closed on
Nov 2, 2001
Sold by
Ward Roy T
Bought by
Dean Gary L
Create a Home Valuation Report for This Property
The Home Valuation Report is an in-depth analysis detailing your home's value as well as a comparison with similar homes in the area
Home Values in the Area
Average Home Value in this Area
Purchase History
| Date | Buyer | Sale Price | Title Company |
|---|---|---|---|
| Kirsche Kevin M | $325,000 | -- | |
| Jenkins Amanda D | -- | -- | |
| Jenkins John Taylor | -- | -- | |
| Dean Gary L | $210,000 | -- |
Source: Public Records
Mortgage History
| Date | Status | Borrower | Loan Amount |
|---|---|---|---|
| Open | Kirsche Kevin M | $285,000 | |
| Previous Owner | Jenkins Amanda D | $211,000 |
Source: Public Records
Tax History Compared to Growth
Tax History
| Year | Tax Paid | Tax Assessment Tax Assessment Total Assessment is a certain percentage of the fair market value that is determined by local assessors to be the total taxable value of land and additions on the property. | Land | Improvement |
|---|---|---|---|---|
| 2024 | $6,737 | $277,116 | $30,000 | $247,116 |
| 2023 | $6,163 | $263,507 | $30,000 | $233,507 |
| 2022 | $5,640 | $233,124 | $30,000 | $203,124 |
| 2021 | $4,369 | $168,800 | $24,000 | $144,800 |
| 2020 | $3,751 | $143,454 | $24,000 | $119,454 |
| 2019 | $3,662 | $139,321 | $24,000 | $115,321 |
| 2018 | $3,387 | $126,544 | $19,200 | $107,344 |
| 2017 | $3,078 | $114,400 | $19,200 | $95,200 |
| 2016 | $2,912 | $107,902 | $17,200 | $90,702 |
| 2015 | $2,938 | $108,428 | $17,200 | $91,228 |
| 2014 | $2,909 | $105,027 | $17,200 | $87,827 |
| 2013 | -- | $102,482 | $17,200 | $85,282 |
Source: Public Records
Map
Nearby Homes
- 96 Morrison St Unit 53
- 92 Morrison St Unit 54
- 90 Morrison St Unit 55
- 96 Morrison St
- 90 Morrison St
- 70, 72 Colham Ferry Extension
- 1345 Harmony Bend
- 1385 Harmony Bend
- Cottage 5 Plan at Trove
- Cottage 6 Plan at Trove
- Cottage 4 Plan at Trove
- Cottage 3 Plan at Trove
- Cottage 2 Plan at Trove
- 1380 Melody Bend
- 1255 Melody Bend
- 1255 Melody Bend Unit 2
- 1075 Harmony Bend Unit LOT 24
- 157 S Main St
- 88 Morrison St
- 88 Morrison St Unit 56