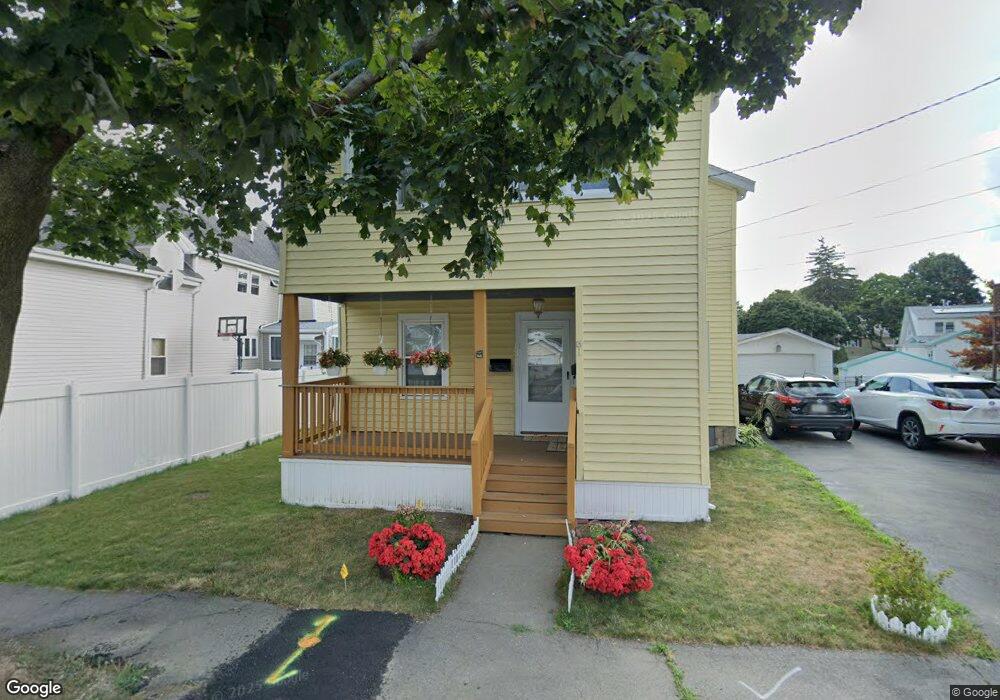
61 John St Quincy, MA 02171
Montclair NeighborhoodEstimated Value: $894,000 - $1,002,000
5
Beds
2
Baths
2,154
Sq Ft
$436/Sq Ft
Est. Value
About This Home
This home is located at 61 John St, Quincy, MA 02171 and is currently estimated at $939,783, approximately $436 per square foot. 61 John St is a home located in Norfolk County with nearby schools including Montclair Elementary School, Atlantic Middle School, and North Quincy High School.
Ownership History
Date
Name
Owned For
Owner Type
Purchase Details
Closed on
Mar 7, 2023
Sold by
Zhouxie Aiqiong
Bought by
Chen Ren Q and Dong Saiqin
Current Estimated Value
Purchase Details
Closed on
Jan 9, 2022
Sold by
Zhou Aiqiong
Bought by
Zhouxie Aiqiong
Home Financials for this Owner
Home Financials are based on the most recent Mortgage that was taken out on this home.
Original Mortgage
$248,216
Interest Rate
3.11%
Mortgage Type
Stand Alone Refi Refinance Of Original Loan
Purchase Details
Closed on
Aug 25, 2010
Sold by
Deutsche Bank Natl T C
Bought by
Zhou Aiqiong
Purchase Details
Closed on
Apr 1, 2010
Sold by
Jordon James and Deutsche Bank Natl T C
Bought by
Deutsche Bank Natl T C
Purchase Details
Closed on
Feb 1, 2002
Sold by
Murphy Patrick M and Murphy Deirdre N
Bought by
Jordan James
Home Financials for this Owner
Home Financials are based on the most recent Mortgage that was taken out on this home.
Original Mortgage
$238,500
Interest Rate
7.15%
Mortgage Type
Purchase Money Mortgage
Purchase Details
Closed on
Dec 16, 1998
Sold by
Kearns Dorothy M
Bought by
Murphy Patrick M and Murphy Deirdre N
Home Financials for this Owner
Home Financials are based on the most recent Mortgage that was taken out on this home.
Original Mortgage
$172,800
Interest Rate
6.85%
Mortgage Type
Purchase Money Mortgage
Create a Home Valuation Report for This Property
The Home Valuation Report is an in-depth analysis detailing your home's value as well as a comparison with similar homes in the area
Home Values in the Area
Average Home Value in this Area
Purchase History
| Date | Buyer | Sale Price | Title Company |
|---|---|---|---|
| Chen Ren Q | $950,000 | None Available | |
| Chen Ren Q | $950,000 | None Available | |
| Zhouxie Aiqiong | -- | None Available | |
| Zhouxie Aiqiong | -- | None Available | |
| Zhou Aiqiong | $330,000 | -- | |
| Zhou Aiqiong | $330,000 | -- | |
| Deutsche Bank Natl T C | $261,293 | -- | |
| Deutsche Bank Natl T C | $261,293 | -- | |
| Jordan James | $265,000 | -- | |
| Jordan James | $265,000 | -- | |
| Murphy Patrick M | $192,000 | -- |
Source: Public Records
Mortgage History
| Date | Status | Borrower | Loan Amount |
|---|---|---|---|
| Previous Owner | Zhouxie Aiqiong | $248,216 | |
| Previous Owner | Jordan James | $238,500 | |
| Previous Owner | Murphy Patrick M | $172,800 |
Source: Public Records
Tax History
| Year | Tax Paid | Tax Assessment Tax Assessment Total Assessment is a certain percentage of the fair market value that is determined by local assessors to be the total taxable value of land and additions on the property. | Land | Improvement |
|---|---|---|---|---|
| 2025 | $10,123 | $878,000 | $387,100 | $490,900 |
| 2024 | $9,763 | $866,300 | $387,100 | $479,200 |
| 2023 | $9,276 | $833,400 | $368,600 | $464,800 |
| 2022 | $8,961 | $748,000 | $320,500 | $427,500 |
| 2021 | $8,845 | $728,600 | $305,300 | $423,300 |
| 2020 | $8,461 | $680,700 | $305,300 | $375,400 |
| 2019 | $8,040 | $640,600 | $285,300 | $355,300 |
| 2018 | $7,625 | $571,600 | $264,200 | $307,400 |
| 2017 | $7,682 | $542,100 | $251,700 | $290,400 |
| 2016 | $6,835 | $476,000 | $218,800 | $257,200 |
| 2015 | $6,468 | $443,000 | $199,000 | $244,000 |
| 2014 | $5,681 | $382,300 | $189,400 | $192,900 |
Source: Public Records
Map
Nearby Homes
- 115 W Squantum St Unit 517
- 115 W Squantum St Unit 203
- 115 W Squantum St Unit 811
- 100 W Squantum St Unit 411
- 54 Safford St
- 98 Safford St
- 107 Fayette St
- 17 Holmes St Unit 204
- 17 Holmes St Unit 2
- 17 Holmes St Unit 1
- 154 N Central Ave
- 85 E Squantum St Unit 10
- 85 Myrtle St Unit 106
- 70 Walnut St
- 150 Hancock St Unit 101
- 10 Weston Ave Unit 322
- 267-269 Farrington St
- 30 Elmwood Park
- 20 Ellington Rd
- 135 E Squantum St
- 61-63 John St Unit 63
- 61 John St Unit 61
- 61-63 John St
- 63 John St Unit 63
- 67 John St
- 55 John St
- 62 John St
- 143 W Squantum St
- 161 W Squantum St
- 53 John St
- 49 John St
- 54 Division St
- 3 Small St
- 165 W Squantum St Unit 1L
- 56 John St
- 56 John St Unit 1
- 56 John St
- 46 Division St
- 139 W Squantum St
- 52 John St
Your Personal Tour Guide
Ask me questions while you tour the home.