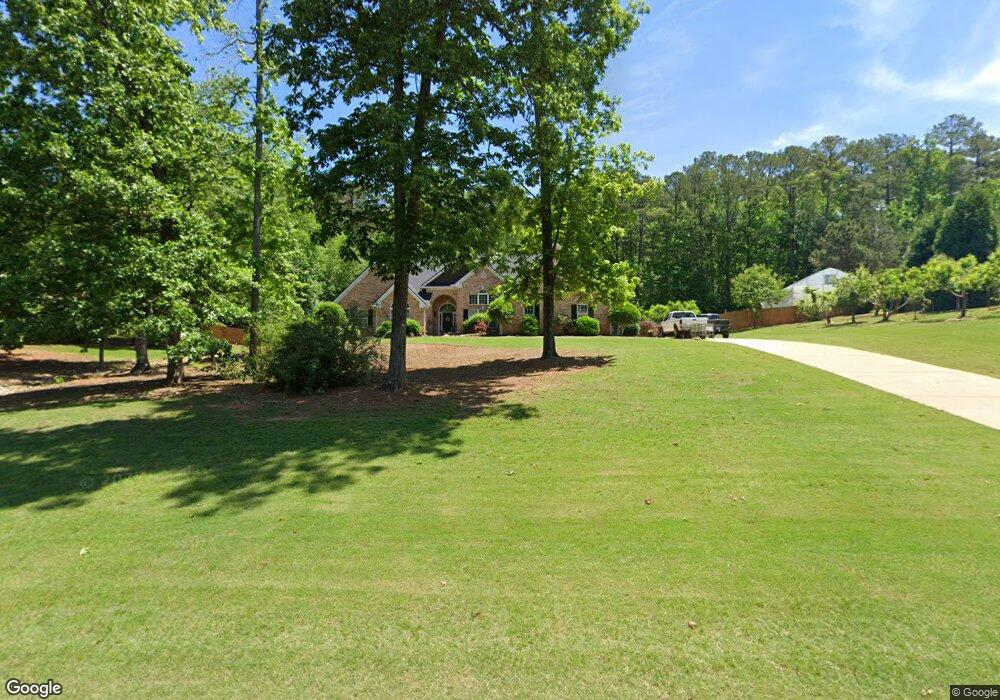
61 Kendall St Newnan, GA 30263
Estimated Value: $519,993 - $595,000
3
Beds
4
Baths
3,536
Sq Ft
$159/Sq Ft
Est. Value
About This Home
This home is located at 61 Kendall St, Newnan, GA 30263 and is currently estimated at $563,498, approximately $159 per square foot. 61 Kendall St is a home located in Coweta County with nearby schools including Northside Elementary School, Madras Middle School, and Newnan High School.
Ownership History
Date
Name
Owned For
Owner Type
Purchase Details
Closed on
May 27, 2009
Sold by
Noble Aaron M
Bought by
Noble Aaron M and Noble Golda
Current Estimated Value
Home Financials for this Owner
Home Financials are based on the most recent Mortgage that was taken out on this home.
Original Mortgage
$196,000
Outstanding Balance
$124,102
Interest Rate
4.81%
Mortgage Type
New Conventional
Estimated Equity
$439,396
Purchase Details
Closed on
May 13, 2005
Sold by
Bellwood Homes Llc
Bought by
Noble Aaron M
Home Financials for this Owner
Home Financials are based on the most recent Mortgage that was taken out on this home.
Original Mortgage
$197,680
Interest Rate
5.75%
Mortgage Type
New Conventional
Purchase Details
Closed on
Sep 1, 2004
Sold by
R C Development Inc
Bought by
Bellwood Homes Llc
Purchase Details
Closed on
Jul 7, 2003
Sold by
Harris D A
Bought by
R C Development Inc
Create a Home Valuation Report for This Property
The Home Valuation Report is an in-depth analysis detailing your home's value as well as a comparison with similar homes in the area
Home Values in the Area
Average Home Value in this Area
Purchase History
| Date | Buyer | Sale Price | Title Company |
|---|---|---|---|
| Noble Aaron M | -- | -- | |
| Noble Aaron M | $247,100 | -- | |
| Bellwood Homes Llc | $1,312,500 | -- | |
| R C Development Inc | $1,230,000 | -- |
Source: Public Records
Mortgage History
| Date | Status | Borrower | Loan Amount |
|---|---|---|---|
| Open | Noble Aaron M | $196,000 | |
| Previous Owner | Noble Aaron M | $197,680 |
Source: Public Records
Tax History Compared to Growth
Tax History
| Year | Tax Paid | Tax Assessment Tax Assessment Total Assessment is a certain percentage of the fair market value that is determined by local assessors to be the total taxable value of land and additions on the property. | Land | Improvement |
|---|---|---|---|---|
| 2024 | $4,182 | $184,764 | $32,000 | $152,764 |
| 2023 | $4,182 | $196,615 | $32,000 | $164,615 |
| 2022 | $3,874 | $161,955 | $32,000 | $129,955 |
| 2021 | $3,432 | $135,049 | $20,000 | $115,049 |
| 2020 | $3,454 | $135,049 | $20,000 | $115,049 |
| 2019 | $3,335 | $118,747 | $18,000 | $100,747 |
| 2018 | $3,342 | $118,747 | $18,000 | $100,747 |
| 2017 | $3,216 | $114,494 | $18,000 | $96,494 |
| 2016 | $2,923 | $105,643 | $10,000 | $95,643 |
| 2015 | $2,610 | $96,286 | $10,000 | $86,286 |
| 2014 | $2,063 | $83,526 | $10,000 | $73,526 |
Source: Public Records
Map
Nearby Homes
- 34 Maggie Place
- 237 Kory Dr
- 264 Kendall St
- 440 Kory Dr
- 894 Happy Valley Cir
- 44 Fendley Trace
- 571 Kory Dr
- 7 Harris Ct
- 252 Happy Valley Cir
- 64 Redwine Overlook
- 90 Westwind Dr
- 72 W Cove Dr
- 285 Peninsula Cir
- 14 W Shore Ct
- 212 Westwind Dr
- 50 Peninsula Cir
- 62 N Shore at Redwine Dr
- 249 Gibson Rd
- 25 The Terrace
- 10 Cove Dr
- 47 Kendall St
- 81 Kendall St
- 74 Kendall St
- 62 Kendall St
- 115 Kendall St
- 98 Kendall St
- 37 Kendall St
- 95 Maple Creek Dr
- 118 Kendall St
- 127 Maple Creek Dr
- 155 Maple Creek Dr Unit 19
- 155 Maple Creek Dr
- 125 Kendall St
- 912 Buddy West Rd
- 81 Maple Creek Dr
- 0 Maple Creek Dr Unit 8674938
- 0 Maple Creek Dr Unit 8965999
- 0 Maple Creek Dr Unit 8925709
- 0 Maple Creek Dr Unit 3181690
- 0 Maple Creek Dr Unit 3206398