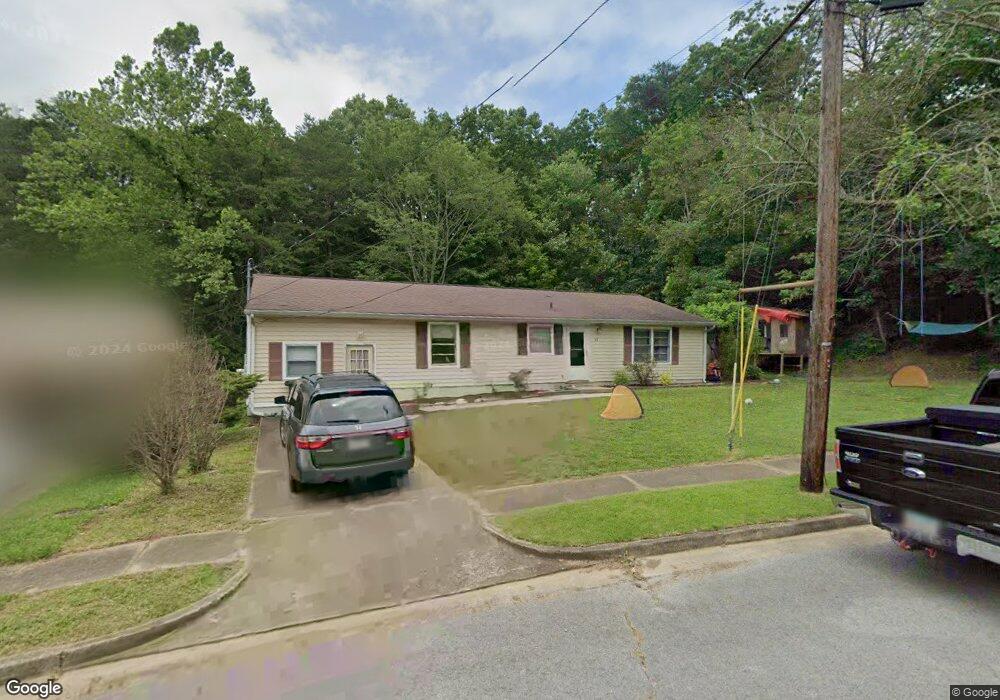
61 Krupski Loop Lookout Mountain, GA 30750
Estimated Value: $246,324 - $467,000
--
Bed
3
Baths
2,288
Sq Ft
$158/Sq Ft
Est. Value
About This Home
This home is located at 61 Krupski Loop, Lookout Mountain, GA 30750 and is currently estimated at $361,081, approximately $157 per square foot. 61 Krupski Loop is a home located in Dade County with nearby schools including Fairyland Elementary School, Chattanooga Valley Middle School, and Ridgeland High School.
Ownership History
Date
Name
Owned For
Owner Type
Purchase Details
Closed on
Oct 25, 2007
Sold by
Steele Timothy Howar
Bought by
Gardner Paul D and Gardner Kristen L
Current Estimated Value
Purchase Details
Closed on
Jun 28, 2007
Sold by
Steele Timothy Howard
Bought by
Gardner Paul D and Gardner Kristen L
Home Financials for this Owner
Home Financials are based on the most recent Mortgage that was taken out on this home.
Original Mortgage
$85,000
Interest Rate
6.37%
Mortgage Type
New Conventional
Purchase Details
Closed on
Aug 31, 1998
Sold by
Hoover Tanya
Bought by
Steele Timothy Howar
Purchase Details
Closed on
Aug 27, 1991
Sold by
David Hoover
Bought by
Hoover Tanya
Purchase Details
Closed on
Feb 15, 1980
Sold by
Hoover David P and Hoover Tan
Purchase Details
Closed on
Jan 21, 1974
Sold by
Hurley James B and Hurley Phy
Purchase Details
Closed on
Jul 8, 1968
Sold by
Belz Joel and Belz Diana E
Create a Home Valuation Report for This Property
The Home Valuation Report is an in-depth analysis detailing your home's value as well as a comparison with similar homes in the area
Home Values in the Area
Average Home Value in this Area
Purchase History
| Date | Buyer | Sale Price | Title Company |
|---|---|---|---|
| Gardner Paul D | $95,000 | -- | |
| Gardner Paul D | $95,000 | -- | |
| Steele Timothy Howar | $46,000 | -- | |
| Hoover Tanya | -- | -- | |
| -- | $35,000 | -- | |
| -- | -- | -- | |
| -- | $11,000 | -- |
Source: Public Records
Mortgage History
| Date | Status | Borrower | Loan Amount |
|---|---|---|---|
| Previous Owner | Gardner Paul D | $85,000 |
Source: Public Records
Tax History Compared to Growth
Tax History
| Year | Tax Paid | Tax Assessment Tax Assessment Total Assessment is a certain percentage of the fair market value that is determined by local assessors to be the total taxable value of land and additions on the property. | Land | Improvement |
|---|---|---|---|---|
| 2024 | $1,362 | $75,184 | $8,000 | $67,184 |
| 2023 | $1,678 | $74,944 | $8,000 | $66,944 |
| 2022 | $1,416 | $63,804 | $8,000 | $55,804 |
| 2021 | $1,314 | $58,680 | $8,000 | $50,680 |
| 2020 | $1,347 | $57,720 | $8,000 | $49,720 |
| 2019 | $1,384 | $58,720 | $8,000 | $50,720 |
| 2018 | $1,409 | $58,720 | $8,000 | $50,720 |
| 2017 | $1,198 | $49,920 | $8,000 | $41,920 |
| 2016 | $1,193 | $49,920 | $8,000 | $41,920 |
| 2015 | $1,166 | $49,920 | $8,000 | $41,920 |
| 2014 | -- | $50,160 | $8,000 | $42,160 |
| 2013 | -- | $43,900 | $8,000 | $35,900 |
Source: Public Records
Map
Nearby Homes
- 0 Stonesthrow Ln Unit 1376808
- 0 Stonesthrow Ln Unit 1512290
- 0 Stonesthrow Ln Unit RTC2886827
- 418 Brow Wood Ln
- 106 Founding Way
- Ashleigh (with Bonus) Plan at The Cottages at Brow Wood
- Everleigh (No Bonus) Plan at The Cottages at Brow Wood
- Ashleigh Plan at The Cottages at Brow Wood
- Waverleigh Plan at The Cottages at Brow Wood
- 154 Founding Way B Way
- 154 Founding Way Unit B
- 1815 Lula Lake Rd
- 206 Arvle York Cir
- 16 Bagby Ln
- 1612 Lula Lake Rd
- 401 Mcfarland Rd
- 302 Mcfarland Rd
- 406 Fort Trace Rd
- 1300 Elfin Rd
- 1212 Cinderella Rd
- 51 Krupski Loop
- 64 Krupski Loop
- 180 Krupski Loop
- 36 Krupski Loop
- 91 Krupski Loop
- 35 Krupski Loop
- 92 Krupski Loop
- 10 Krupski Loop
- 190 Krupski Loop
- 100 Krupski Loop
- 11 Krupski Loop
- 416 Krupski Loop
- 41 Carter Dr
- 22 Carter Dr
- 191 Krupski Loop
- 0 Maggie Bluff Unit 1348611
- 0 Maggie Bluff Unit 1257494
- 0 Maggie Bluff Unit 1257497
- 0 Maggie Bluff Unit RTC2731170
- 0 Maggie Bluff Unit RTC2731168