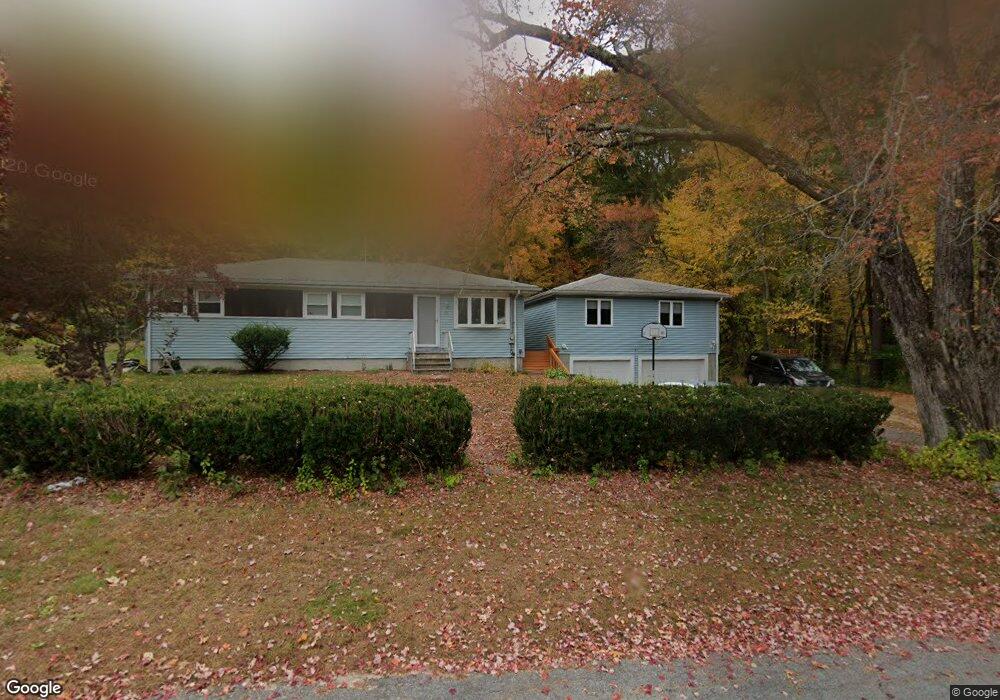
61 Larned Rd Oxford, MA 01540
Estimated Value: $459,000 - $485,467
3
Beds
1
Bath
1,196
Sq Ft
$395/Sq Ft
Est. Value
About This Home
This home is located at 61 Larned Rd, Oxford, MA 01540 and is currently estimated at $472,867, approximately $395 per square foot. 61 Larned Rd is a home located in Worcester County with nearby schools including Alfred M Chaffee, Oxford High School, and Clara Barton Elementary School.
Ownership History
Date
Name
Owned For
Owner Type
Purchase Details
Closed on
Sep 29, 2025
Sold by
Murray Patricia A and Murray Jeffrey B
Bought by
Murray Patricia A and Murray Jeffrey B
Current Estimated Value
Home Financials for this Owner
Home Financials are based on the most recent Mortgage that was taken out on this home.
Original Mortgage
$30,000
Outstanding Balance
$29,987
Interest Rate
6.56%
Mortgage Type
Credit Line Revolving
Estimated Equity
$442,880
Purchase Details
Closed on
May 1, 2006
Sold by
Talman Margaret M and Murray Patricia A
Bought by
Talman Margaret M and Murray Patricia A
Home Financials for this Owner
Home Financials are based on the most recent Mortgage that was taken out on this home.
Original Mortgage
$103,400
Interest Rate
6.4%
Mortgage Type
Purchase Money Mortgage
Create a Home Valuation Report for This Property
The Home Valuation Report is an in-depth analysis detailing your home's value as well as a comparison with similar homes in the area
Home Values in the Area
Average Home Value in this Area
Purchase History
| Date | Buyer | Sale Price | Title Company |
|---|---|---|---|
| Murray Patricia A | -- | -- | |
| Talman Margaret M | -- | -- | |
| Talman Margaret M | -- | -- |
Source: Public Records
Mortgage History
| Date | Status | Borrower | Loan Amount |
|---|---|---|---|
| Open | Murray Patricia A | $30,000 | |
| Previous Owner | Talman Margaret M | $103,400 | |
| Previous Owner | Talman Margaret M | $78,500 | |
| Previous Owner | Talman Margaret M | $54,000 |
Source: Public Records
Tax History Compared to Growth
Tax History
| Year | Tax Paid | Tax Assessment Tax Assessment Total Assessment is a certain percentage of the fair market value that is determined by local assessors to be the total taxable value of land and additions on the property. | Land | Improvement |
|---|---|---|---|---|
| 2025 | $58 | $458,600 | $121,900 | $336,700 |
| 2024 | $5,562 | $412,600 | $112,600 | $300,000 |
| 2023 | $5,497 | $403,000 | $100,600 | $302,400 |
| 2022 | $5,000 | $309,400 | $71,400 | $238,000 |
| 2021 | $4,660 | $281,900 | $67,800 | $214,100 |
| 2020 | $4,498 | $270,000 | $67,800 | $202,200 |
| 2019 | $3,673 | $215,700 | $67,800 | $147,900 |
| 2018 | $3,475 | $201,200 | $67,800 | $133,400 |
| 2017 | $3,501 | $207,800 | $67,800 | $140,000 |
| 2016 | $3,518 | $207,800 | $67,800 | $140,000 |
| 2015 | $3,281 | $207,800 | $67,800 | $140,000 |
| 2014 | $3,249 | $216,600 | $67,800 | $148,800 |
Source: Public Records
Map
Nearby Homes