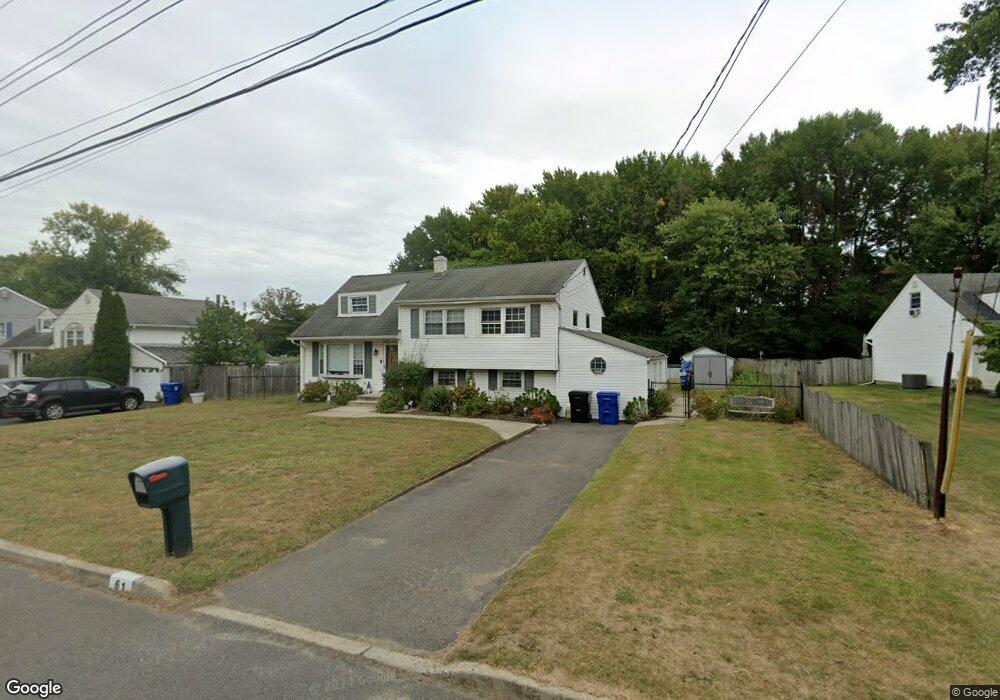
61 Libby Place Middletown, NJ 07748
New Monmouth NeighborhoodEstimated Value: $672,000 - $763,000
4
Beds
2
Baths
2,019
Sq Ft
$354/Sq Ft
Est. Value
About This Home
This home is located at 61 Libby Place, Middletown, NJ 07748 and is currently estimated at $714,890, approximately $354 per square foot. 61 Libby Place is a home located in Monmouth County with nearby schools including New Monmouth Elementary School, Thorne Middle School, and Middletown High School North.
Ownership History
Date
Name
Owned For
Owner Type
Purchase Details
Closed on
Dec 28, 2016
Sold by
Horst Scott and Horst Kelly
Bought by
Horst Kelly and Golembeski Kelly
Current Estimated Value
Purchase Details
Closed on
Sep 6, 2005
Sold by
Farley Geraldine
Bought by
Horst Scott and Horst Kelly
Home Financials for this Owner
Home Financials are based on the most recent Mortgage that was taken out on this home.
Original Mortgage
$215,000
Interest Rate
5.93%
Mortgage Type
New Conventional
Purchase Details
Closed on
Jun 28, 1996
Sold by
Hart Kathleen
Bought by
Farley Dermot and Farley Geraldine
Home Financials for this Owner
Home Financials are based on the most recent Mortgage that was taken out on this home.
Original Mortgage
$120,000
Interest Rate
8.37%
Create a Home Valuation Report for This Property
The Home Valuation Report is an in-depth analysis detailing your home's value as well as a comparison with similar homes in the area
Home Values in the Area
Average Home Value in this Area
Purchase History
| Date | Buyer | Sale Price | Title Company |
|---|---|---|---|
| Horst Kelly | -- | None Available | |
| Horst Scott | $385,000 | -- | |
| Farley Dermot | $150,000 | -- |
Source: Public Records
Mortgage History
| Date | Status | Borrower | Loan Amount |
|---|---|---|---|
| Previous Owner | Horst Scott | $215,000 | |
| Previous Owner | Farley Dermot | $120,000 |
Source: Public Records
Tax History
| Year | Tax Paid | Tax Assessment Tax Assessment Total Assessment is a certain percentage of the fair market value that is determined by local assessors to be the total taxable value of land and additions on the property. | Land | Improvement |
|---|---|---|---|---|
| 2025 | $9,189 | $606,900 | $390,600 | $216,300 |
| 2024 | $7,823 | $558,600 | $346,300 | $212,300 |
Source: Public Records
Map
Nearby Homes
Your Personal Tour Guide
Ask me questions while you tour the home.