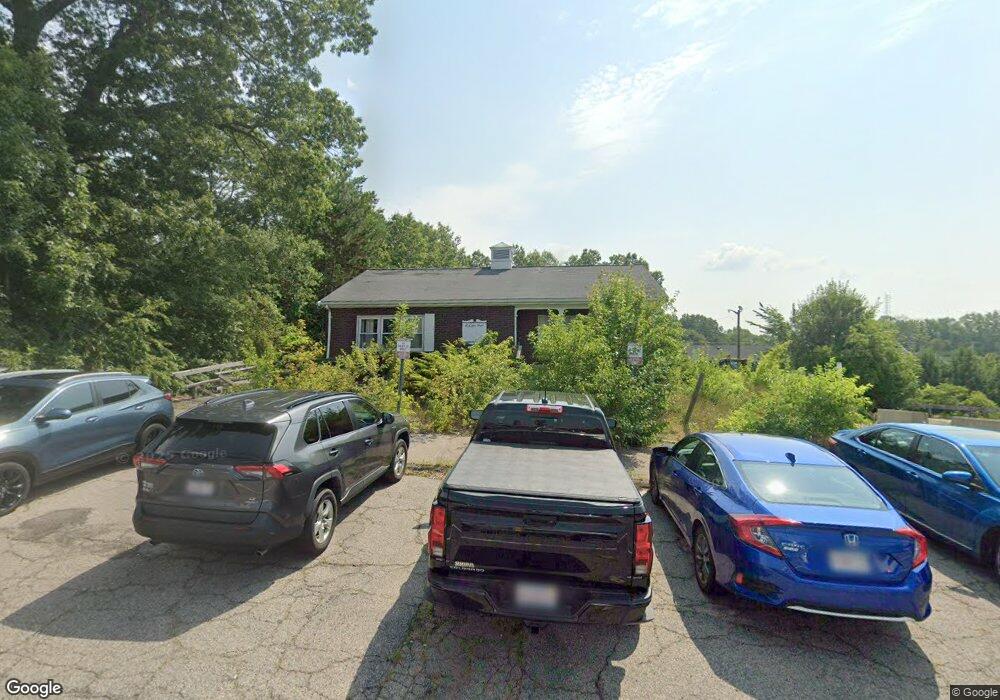
61 Libby St Brockton, MA 02302
Estimated Value: $721,755
3
Beds
1
Bath
912
Sq Ft
$791/Sq Ft
Est. Value
About This Home
This home is located at 61 Libby St, Brockton, MA 02302 and is currently estimated at $721,755, approximately $791 per square foot. 61 Libby St is a home located in Plymouth County with nearby schools including Brookfield Elementary School, Mary E. Baker Elementary School, and Downey Elementary School.
Ownership History
Date
Name
Owned For
Owner Type
Purchase Details
Closed on
Jan 31, 2014
Sold by
61 Libby Street Llc
Bought by
Brockton Hospital Inc
Current Estimated Value
Purchase Details
Closed on
Jan 25, 2007
Sold by
Cam T
Bought by
61 Libby Street Llc
Home Financials for this Owner
Home Financials are based on the most recent Mortgage that was taken out on this home.
Original Mortgage
$280,000
Interest Rate
6.15%
Mortgage Type
Commercial
Create a Home Valuation Report for This Property
The Home Valuation Report is an in-depth analysis detailing your home's value as well as a comparison with similar homes in the area
Home Values in the Area
Average Home Value in this Area
Purchase History
| Date | Buyer | Sale Price | Title Company |
|---|---|---|---|
| Brockton Hospital Inc | $325,000 | -- | |
| 61 Libby Street Llc | $350,000 | -- |
Source: Public Records
Mortgage History
| Date | Status | Borrower | Loan Amount |
|---|---|---|---|
| Previous Owner | 61 Libby Street Llc | $280,000 | |
| Previous Owner | 61 Libby Street Llc | $308,000 |
Source: Public Records
Tax History Compared to Growth
Tax History
| Year | Tax Paid | Tax Assessment Tax Assessment Total Assessment is a certain percentage of the fair market value that is determined by local assessors to be the total taxable value of land and additions on the property. | Land | Improvement |
|---|---|---|---|---|
| 2025 | -- | $597,500 | $235,600 | $361,900 |
| 2024 | -- | $581,200 | $235,600 | $345,600 |
| 2023 | $0 | $520,200 | $204,500 | $315,700 |
| 2022 | $0 | $492,800 | $204,500 | $288,300 |
| 2021 | $0 | $470,300 | $194,800 | $275,500 |
| 2020 | $0 | $423,300 | $185,500 | $237,800 |
| 2019 | $0 | $371,900 | $185,500 | $186,400 |
| 2018 | $0 | $371,900 | $185,500 | $186,400 |
| 2017 | $0 | $371,900 | $185,500 | $186,400 |
| 2016 | -- | $370,440 | $185,480 | $184,960 |
| 2015 | -- | $370,440 | $185,480 | $184,960 |
| 2014 | $12,895 | $379,700 | $185,480 | $194,220 |
Source: Public Records
Map
Nearby Homes
- 47 Libby St
- 225 Quincy Ave
- 210 Quincy Ave
- 201 Quincy St
- 211 Quincy St
- 205 Quincy St
- 29 Libby St
- 179 Quincy St
- 179 Quincy St Unit C
- 209 Quincy St Unit 209
- 19 Libby St
- 11 Cranston St
- 11 Cranston St Unit 11
- 210 Quincy St
- 231 Quincy St
- 216 Quincy St
- 204 Quincy St
- 200 Quincy St
- 233 Quincy St
- 224 Quincy St