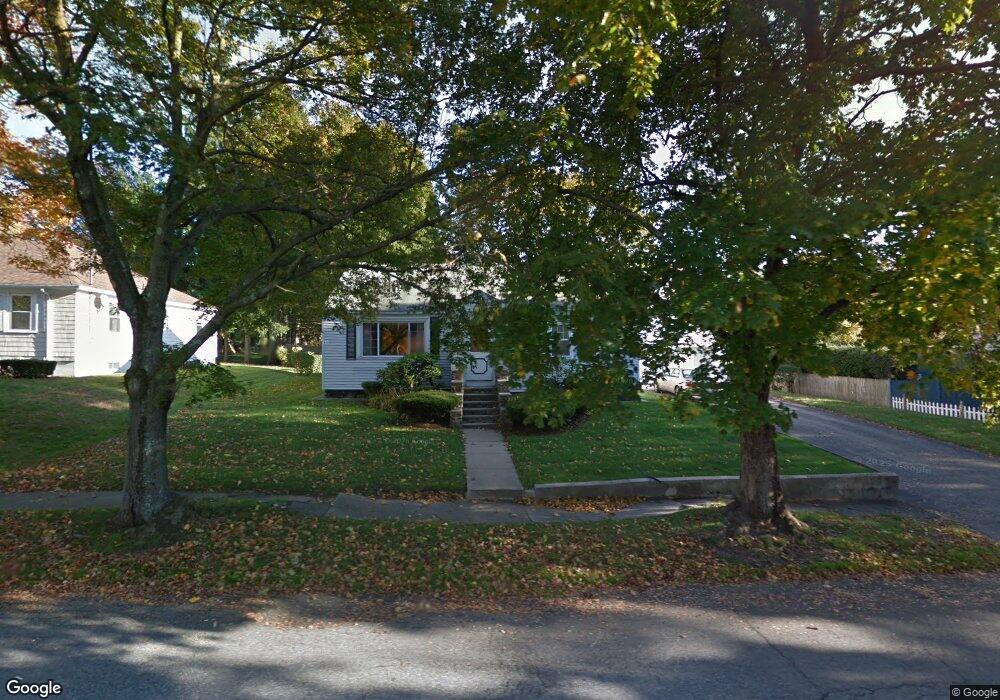
61 Lyman Rd North Andover, MA 01845
Estimated Value: $592,000 - $648,000
3
Beds
2
Baths
1,260
Sq Ft
$498/Sq Ft
Est. Value
About This Home
This home is located at 61 Lyman Rd, North Andover, MA 01845 and is currently estimated at $626,982, approximately $497 per square foot. 61 Lyman Rd is a home located in Essex County with nearby schools including Thomson Elementary School, North Andover Middle School, and North Andover High School.
Ownership History
Date
Name
Owned For
Owner Type
Purchase Details
Closed on
May 9, 2025
Sold by
Beninato Joseph and Beninato Sharon
Bought by
Beninato 2020 T and Beninato B
Current Estimated Value
Purchase Details
Closed on
Aug 23, 2024
Sold by
Beninato Ft and Beninato
Bought by
Beninato Joseph and Beninato Sharon
Home Financials for this Owner
Home Financials are based on the most recent Mortgage that was taken out on this home.
Original Mortgage
$431,250
Interest Rate
6.89%
Mortgage Type
Purchase Money Mortgage
Purchase Details
Closed on
Dec 22, 2008
Sold by
Beninato Philip P and Beninato Elvira R
Bought by
Beninato Irt
Create a Home Valuation Report for This Property
The Home Valuation Report is an in-depth analysis detailing your home's value as well as a comparison with similar homes in the area
Home Values in the Area
Average Home Value in this Area
Purchase History
| Date | Buyer | Sale Price | Title Company |
|---|---|---|---|
| Beninato 2020 T | -- | None Available | |
| Beninato 2020 T | -- | None Available | |
| Beninato Joseph | $575,000 | None Available | |
| Beninato Joseph | $575,000 | None Available | |
| Beninato Joseph | $575,000 | None Available | |
| Beninato Irt | -- | -- | |
| Beninato Irt | -- | -- |
Source: Public Records
Mortgage History
| Date | Status | Borrower | Loan Amount |
|---|---|---|---|
| Previous Owner | Beninato Joseph | $431,250 |
Source: Public Records
Tax History Compared to Growth
Tax History
| Year | Tax Paid | Tax Assessment Tax Assessment Total Assessment is a certain percentage of the fair market value that is determined by local assessors to be the total taxable value of land and additions on the property. | Land | Improvement |
|---|---|---|---|---|
| 2025 | $5,878 | $522,000 | $298,900 | $223,100 |
| 2024 | $5,597 | $504,700 | $281,400 | $223,300 |
| 2023 | $5,644 | $461,100 | $258,500 | $202,600 |
| 2022 | $5,577 | $412,200 | $232,100 | $180,100 |
| 2021 | $5,346 | $377,300 | $211,000 | $166,300 |
| 2020 | $5,033 | $366,300 | $211,000 | $155,300 |
| 2019 | $4,912 | $366,300 | $211,000 | $155,300 |
| 2018 | $5,322 | $366,300 | $211,000 | $155,300 |
| 2017 | $4,517 | $316,300 | $174,100 | $142,200 |
| 2016 | $4,250 | $297,800 | $170,800 | $127,000 |
| 2015 | $4,154 | $288,700 | $164,900 | $123,800 |
Source: Public Records
Map
Nearby Homes
- 11 Putnam Rd
- 8 Little Rd
- 33 Pilgrim St
- 183 Massachusetts Ave
- 177-179 Massachusetts Ave
- 350 Greene St Unit 105
- 59 Maple Ave Unit 59
- 416 Waverley Rd
- 24 Faulkner Rd
- 11 Fernwood St
- 114 Beverly St
- 88 Elm St Unit 1
- 92 Martin Ave
- 148-150 Water St
- 24 Marblehead St
- 133 Autran Ave
- 148 Main St Unit S327
- 148 Main St Unit O102
- 148 Main St Unit A510
- 125 Phillips Brooks Rd