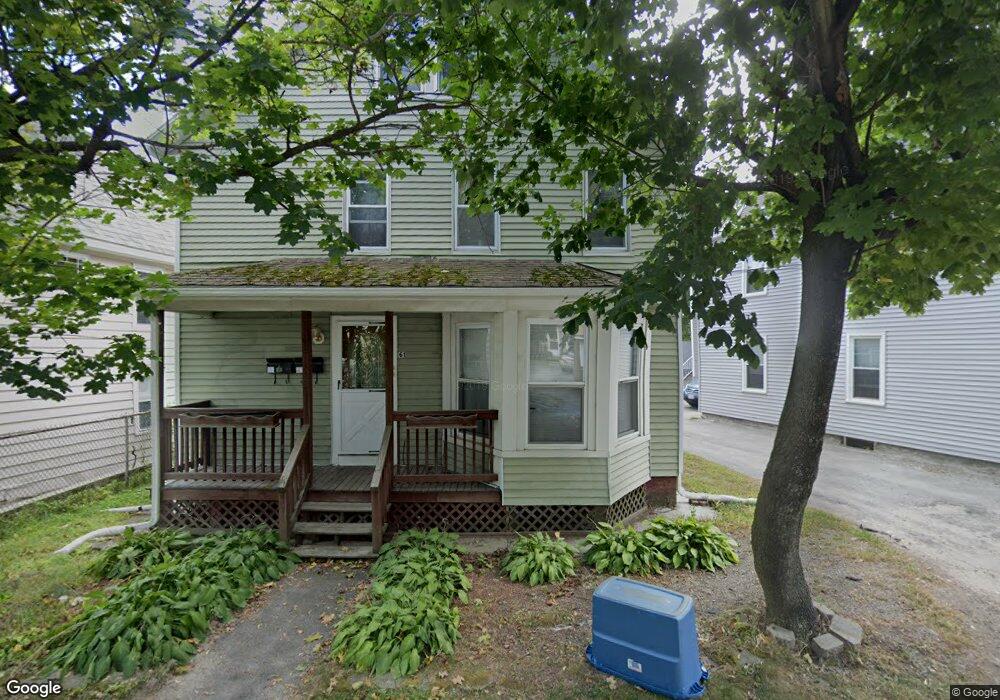
61 Lyman St Worcester, MA 01603
Hadwen Park NeighborhoodEstimated Value: $369,207 - $539,000
4
Beds
2
Baths
1,528
Sq Ft
$283/Sq Ft
Est. Value
About This Home
This home is located at 61 Lyman St, Worcester, MA 01603 and is currently estimated at $432,052, approximately $282 per square foot. 61 Lyman St is a home located in Worcester County with nearby schools including Gates Lane, Jacob Hiatt Magnet School, and Chandler Magnet.
Ownership History
Date
Name
Owned For
Owner Type
Purchase Details
Closed on
Dec 5, 2016
Sold by
Marois James L and Marois Patricia A
Bought by
Bouthiller Ronald R
Current Estimated Value
Home Financials for this Owner
Home Financials are based on the most recent Mortgage that was taken out on this home.
Original Mortgage
$101,250
Outstanding Balance
$52,619
Interest Rate
3.52%
Mortgage Type
New Conventional
Estimated Equity
$379,433
Purchase Details
Closed on
Jun 20, 2000
Sold by
Favreau Rick A
Bought by
Bouthiller Diana M
Purchase Details
Closed on
Aug 7, 1996
Sold by
Admiral Properties Inc
Bought by
Favreau Rick A
Purchase Details
Closed on
Mar 14, 1996
Sold by
Pierce Michael A
Bought by
Admiral Properties
Purchase Details
Closed on
Nov 16, 1989
Sold by
Lazaro Kenneth
Bought by
Pierce Michael
Create a Home Valuation Report for This Property
The Home Valuation Report is an in-depth analysis detailing your home's value as well as a comparison with similar homes in the area
Home Values in the Area
Average Home Value in this Area
Purchase History
| Date | Buyer | Sale Price | Title Company |
|---|---|---|---|
| Bouthiller Ronald R | $135,000 | -- | |
| Bouthiller Diana M | $81,000 | -- | |
| Favreau Rick A | $55,000 | -- | |
| Admiral Properties | $55,000 | -- | |
| Pierce Michael | $70,000 | -- |
Source: Public Records
Mortgage History
| Date | Status | Borrower | Loan Amount |
|---|---|---|---|
| Open | Bouthiller Ronald R | $101,250 | |
| Previous Owner | Pierce Michael | $119,634 | |
| Previous Owner | Pierce Michael | $82,800 |
Source: Public Records
Tax History
| Year | Tax Paid | Tax Assessment Tax Assessment Total Assessment is a certain percentage of the fair market value that is determined by local assessors to be the total taxable value of land and additions on the property. | Land | Improvement |
|---|---|---|---|---|
| 2025 | $3,853 | $292,100 | $54,300 | $237,800 |
| 2024 | $3,669 | $266,800 | $54,300 | $212,500 |
| 2023 | $3,380 | $235,700 | $43,600 | $192,100 |
| 2022 | $3,288 | $216,200 | $34,900 | $181,300 |
| 2021 | $2,857 | $175,500 | $27,900 | $147,600 |
| 2020 | $2,655 | $156,200 | $28,000 | $128,200 |
| 2019 | $2,797 | $155,400 | $27,600 | $127,800 |
| 2018 | $2,721 | $143,900 | $27,600 | $116,300 |
| 2017 | $2,562 | $133,300 | $27,600 | $105,700 |
| 2016 | $2,603 | $126,300 | $22,900 | $103,400 |
| 2015 | $2,535 | $126,300 | $22,900 | $103,400 |
| 2014 | $2,468 | $126,300 | $22,900 | $103,400 |
Source: Public Records
Map
Nearby Homes
- 2 Montague St
- 22 Lanark St
- 23 Lakewood St
- 103 Henshaw St
- 35 Genessee St Unit E
- 26 Sylvan St
- 99 Clover St
- 55 Grandview Ave
- 12 Stoneland Rd
- 5 Stoneland Rd
- 10 Lucian St
- 31 B Gates Rd Unit 22R
- 56 Richards St
- 54 Richards St
- 25 Wyola Dr
- 52 Richards St
- 5 Freeland Terrace
- 103 Illinois St
- 28 Richards St
- 32 Goddard Memorial Dr
Your Personal Tour Guide
Ask me questions while you tour the home.