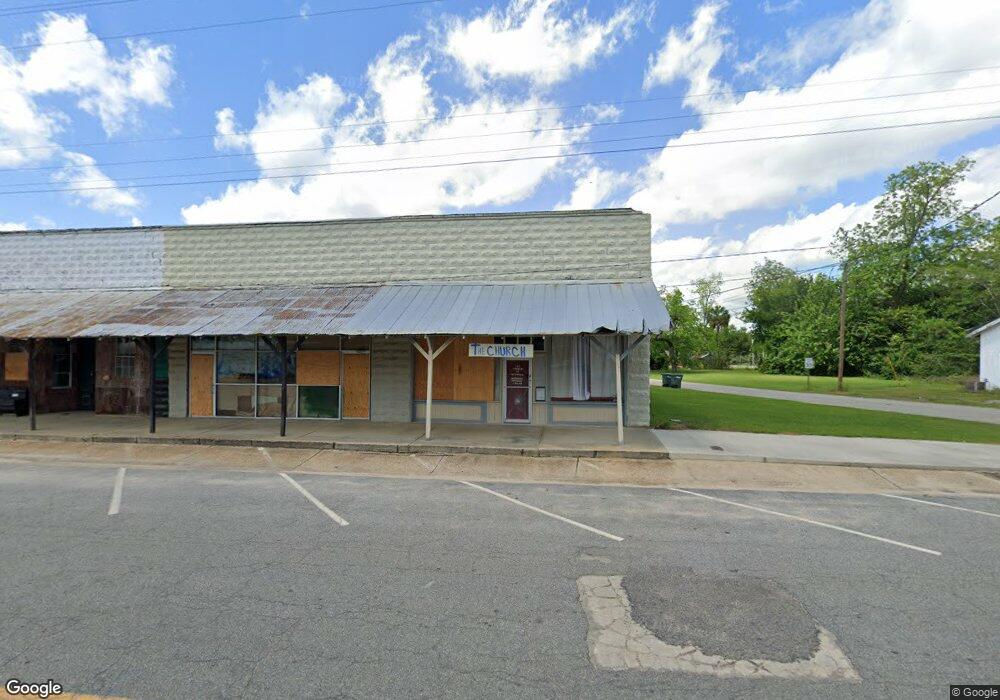
61 Main St Barwick, GA 31720
Estimated Value: $69,507 - $261,000
Studio
--
Bath
3,750
Sq Ft
$40/Sq Ft
Est. Value
About This Home
This home is located at 61 Main St, Barwick, GA 31720 and is currently estimated at $151,169, approximately $40 per square foot. 61 Main St is a home with nearby schools including North Brooks Elementary School.
Ownership History
Date
Name
Owned For
Owner Type
Purchase Details
Closed on
Aug 8, 2019
Sold by
Church Of Barwick Georgia Inc
Bought by
Cone Tiffany and Ryals Angela M
Current Estimated Value
Purchase Details
Closed on
Oct 25, 2014
Sold by
Gandy John
Bought by
The Church Of Barwick Georgia
Purchase Details
Closed on
Feb 14, 2013
Sold by
Mccammon Sandra
Bought by
Mccammon Scott
Purchase Details
Closed on
Feb 7, 2013
Sold by
Mccammon Scott
Bought by
Gandy John
Purchase Details
Closed on
Sep 19, 2008
Sold by
Mccammon Aknthony Scott
Bought by
Mccammon Sandra
Purchase Details
Closed on
Apr 21, 2006
Sold by
Castleberry Mary Sue
Bought by
Mccammon Anthony Scott
Purchase Details
Closed on
Sep 7, 1999
Sold by
Mccammon Anthony Sc
Bought by
Castleberry Mary Sue
Purchase Details
Closed on
Nov 20, 1997
Sold by
Jones Carrie
Bought by
Mccammon Anthony Scott Etal
Purchase Details
Closed on
Aug 14, 1992
Sold by
Howard Riley
Bought by
Jones Carrie
Purchase Details
Closed on
Feb 19, 1991
Sold by
Pickles Curtis
Bought by
Howard Riley
Create a Home Valuation Report for This Property
The Home Valuation Report is an in-depth analysis detailing your home's value as well as a comparison with similar homes in the area
Purchase History
| Date | Buyer | Sale Price | Title Company |
|---|---|---|---|
| Cone Tiffany | -- | -- | |
| The Church Of Barwick Georgia | -- | -- | |
| Mccammon Scott | -- | -- | |
| Gandy John | $30,000 | -- | |
| Mccammon Sandra | -- | -- | |
| Mccammon Anthony Scott | $4,500 | -- | |
| Castleberry Mary Sue | $4,500 | -- | |
| Mccammon Anthony Scott Etal | $6,000 | -- | |
| Jones Carrie | $3,000 | -- | |
| Howard Riley | $2,000 | -- |
Source: Public Records
Tax History
| Year | Tax Paid | Tax Assessment Tax Assessment Total Assessment is a certain percentage of the fair market value that is determined by local assessors to be the total taxable value of land and additions on the property. | Land | Improvement |
|---|---|---|---|---|
| 2025 | $752 | $13,640 | $2,400 | $11,240 |
| 2023 | $612 | $13,640 | $2,400 | $11,240 |
| 2022 | $623 | $12,800 | $2,360 | $10,440 |
| 2021 | $494 | $10,280 | $1,440 | $8,840 |
| 2020 | $385 | $9,200 | $1,440 | $7,760 |
| 2019 | $531 | $13,480 | $1,480 | $12,000 |
| 2018 | $901 | $20,920 | $1,480 | $19,440 |
| 2017 | $871 | $20,360 | $1,480 | $18,880 |
| 2016 | $871 | $20,360 | $1,480 | $18,880 |
| 2015 | -- | $20,360 | $1,480 | $18,880 |
| 2014 | -- | $19,720 | $1,400 | $18,320 |
| 2013 | -- | $2,400 | $880 | $1,520 |
Source: Public Records
Map
Nearby Homes
- 800 Clifford St
- 1038-BA Church St
- 2195 Coffee Rd
- 7402 Coffee Rd
- 431 Dry Lake Rd
- 9900 Ozell Rd
- 4265 Howard Rd
- 0000 0000 Ozell Road (15+ - Acres)
- 1065 W Harris St
- 581 Harris St
- 2773 Georgia 33
- 56 Egypt Rd Unit 10
- 0 Ozell Rd Unit 26629849
- 111 Nicole Britt Dr
- 106 Nicole Britt Dr
- 101 Bailey Cir
- 201 Bailey Cir
- 00000 Austin Lane (3 46 Acres)
- 536 N Leaphart St
- 8447 Airline Rd
Your Personal Tour Guide
Ask me questions while you tour the home.