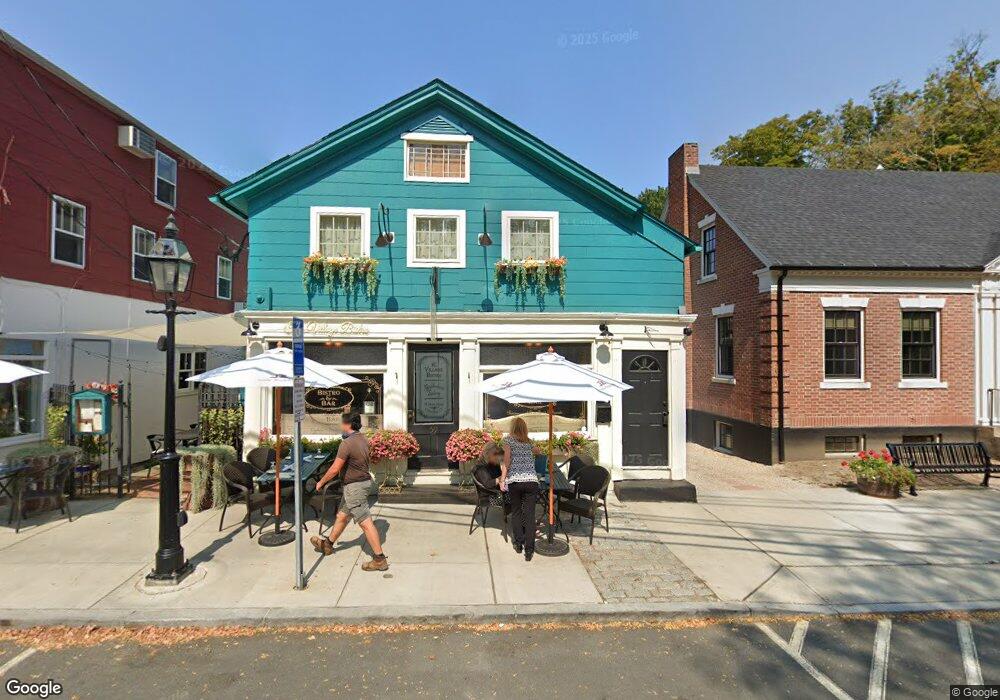
61 Main St Chester, CT 06412
Estimated Value: $658,897 - $806,000
4
Beds
2
Baths
2,256
Sq Ft
$316/Sq Ft
Est. Value
About This Home
This home is located at 61 Main St, Chester, CT 06412 and is currently estimated at $712,724, approximately $315 per square foot. 61 Main St is a home located in Middlesex County with nearby schools including Valley Regional High School.
Ownership History
Date
Name
Owned For
Owner Type
Purchase Details
Closed on
Jul 28, 2009
Sold by
Mulford Jean
Bought by
Budd Bruce
Current Estimated Value
Home Financials for this Owner
Home Financials are based on the most recent Mortgage that was taken out on this home.
Original Mortgage
$333,000
Outstanding Balance
$221,179
Interest Rate
5.58%
Estimated Equity
$491,545
Purchase Details
Closed on
Feb 10, 1995
Sold by
Perlstein Mitchell and Perlstein Karen
Bought by
Mulford Jean P
Purchase Details
Closed on
Sep 11, 1989
Sold by
Kennedy Mary V
Bought by
Perlstein Mitchell
Create a Home Valuation Report for This Property
The Home Valuation Report is an in-depth analysis detailing your home's value as well as a comparison with similar homes in the area
Home Values in the Area
Average Home Value in this Area
Purchase History
| Date | Buyer | Sale Price | Title Company |
|---|---|---|---|
| Budd Bruce | $417,000 | -- | |
| Budd Bruce | $417,000 | -- | |
| Mulford Jean P | $241,000 | -- | |
| Mulford Jean P | $241,000 | -- | |
| Perlstein Mitchell | $278,800 | -- |
Source: Public Records
Mortgage History
| Date | Status | Borrower | Loan Amount |
|---|---|---|---|
| Open | Perlstein Mitchell | $333,000 | |
| Closed | Perlstein Mitchell | $333,000 | |
| Previous Owner | Perlstein Mitchell | $25,000 |
Source: Public Records
Tax History
| Year | Tax Paid | Tax Assessment Tax Assessment Total Assessment is a certain percentage of the fair market value that is determined by local assessors to be the total taxable value of land and additions on the property. | Land | Improvement |
|---|---|---|---|---|
| 2025 | $9,548 | $352,590 | $72,590 | $280,000 |
| 2024 | $8,621 | $352,590 | $72,590 | $280,000 |
| 2023 | $8,510 | $286,520 | $89,770 | $196,750 |
| 2022 | $8,452 | $286,520 | $89,770 | $196,750 |
| 2021 | $8,452 | $286,520 | $89,770 | $196,750 |
| 2020 | $8,200 | $286,520 | $89,770 | $196,750 |
| 2019 | $8,249 | $286,520 | $89,770 | $196,750 |
| 2018 | $7,681 | $283,340 | $94,760 | $188,580 |
| 2017 | $7,469 | $283,340 | $94,760 | $188,580 |
| 2016 | $5,712 | $283,340 | $94,760 | $188,580 |
| 2015 | $7,174 | $283,340 | $94,760 | $188,580 |
| 2014 | $7,032 | $283,340 | $94,760 | $188,580 |
Source: Public Records
Map
Nearby Homes
Your Personal Tour Guide
Ask me questions while you tour the home.