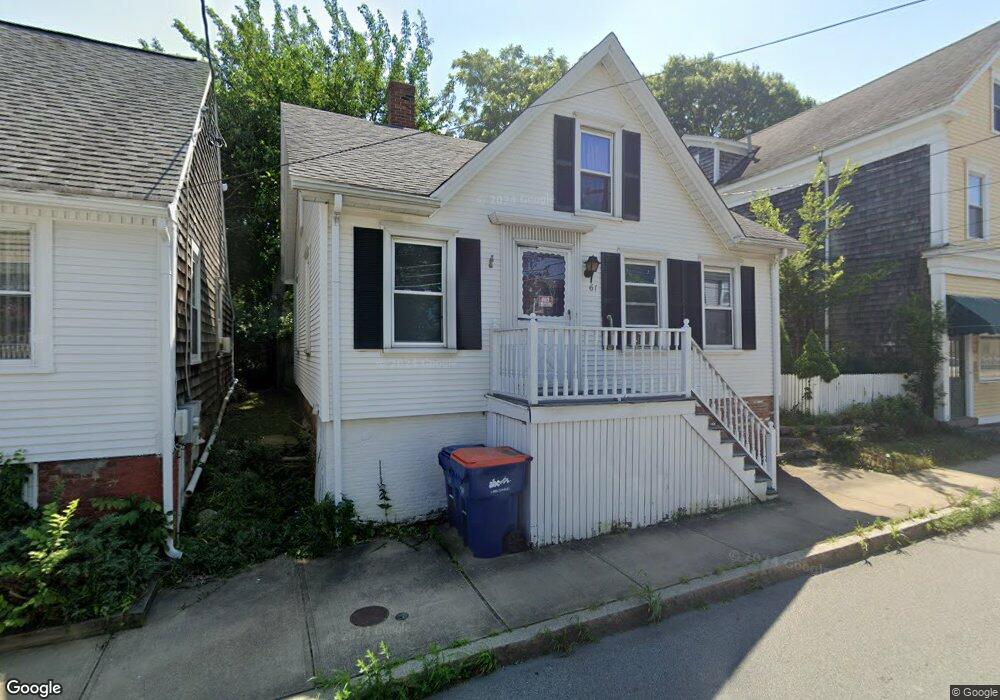
61 Main St Fairhaven, MA 02719
Estimated Value: $373,000 - $448,000
2
Beds
1
Bath
970
Sq Ft
$425/Sq Ft
Est. Value
About This Home
This home is located at 61 Main St, Fairhaven, MA 02719 and is currently estimated at $412,373, approximately $425 per square foot. 61 Main St is a home located in Bristol County with nearby schools including Fairhaven High School, City On A Hill Charter Public School New Bedford, and St. Joseph School.
Ownership History
Date
Name
Owned For
Owner Type
Purchase Details
Closed on
Oct 9, 2019
Sold by
Montplaisir Cecile J
Bought by
Montplaisir Ft
Current Estimated Value
Purchase Details
Closed on
Apr 7, 2010
Sold by
Gonsalves Suzanne L
Bought by
Gonsalves Robert G
Purchase Details
Closed on
Feb 25, 1983
Bought by
Gonsalves Robert G
Create a Home Valuation Report for This Property
The Home Valuation Report is an in-depth analysis detailing your home's value as well as a comparison with similar homes in the area
Home Values in the Area
Average Home Value in this Area
Purchase History
| Date | Buyer | Sale Price | Title Company |
|---|---|---|---|
| Montplaisir Ft | -- | -- | |
| Gonsalves Robert G | -- | -- | |
| Gonsalves Robert G | -- | -- |
Source: Public Records
Mortgage History
| Date | Status | Borrower | Loan Amount |
|---|---|---|---|
| Previous Owner | Gonsalves Robert G | $48,500 |
Source: Public Records
Tax History Compared to Growth
Tax History
| Year | Tax Paid | Tax Assessment Tax Assessment Total Assessment is a certain percentage of the fair market value that is determined by local assessors to be the total taxable value of land and additions on the property. | Land | Improvement |
|---|---|---|---|---|
| 2025 | $3,070 | $329,400 | $134,700 | $194,700 |
| 2024 | $2,943 | $318,900 | $134,700 | $184,200 |
| 2023 | $2,848 | $286,200 | $113,900 | $172,300 |
| 2022 | $2,722 | $266,300 | $103,600 | $162,700 |
| 2021 | $2,552 | $226,000 | $93,200 | $132,800 |
| 2020 | $2,442 | $220,800 | $88,000 | $132,800 |
| 2019 | $2,444 | $209,400 | $88,000 | $121,400 |
| 2018 | $2,294 | $200,100 | $84,200 | $115,900 |
| 2017 | $2,245 | $186,500 | $79,000 | $107,500 |
| 2016 | $2,135 | $175,300 | $77,700 | $97,600 |
| 2015 | $2,108 | $173,500 | $77,700 | $95,800 |
Source: Public Records
Map
Nearby Homes