A
Seller's Agent in 2022
Angela Lee
Keller Williams Realty
(207) 754-4221
138 Total Sales


Estimated Value: $423,000 - $491,000
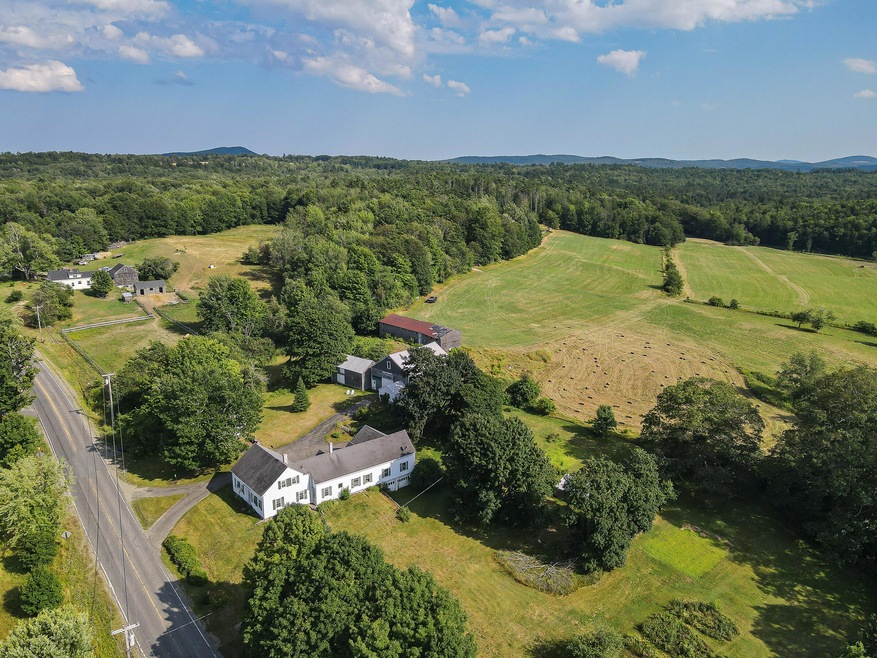
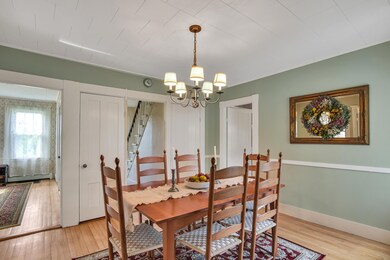
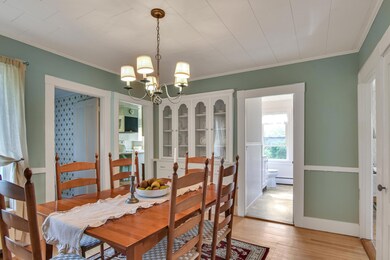
Looking for a country feel home? Look no further! Don't miss this 1900s farmhouse cape on 3.6+/- acres of fields. 4 BR/2 Bath, attached garage, detached antique barn, large second barn, and shed situated on a lovely lot with many perennials! This home is in great condition and is move in ready, without any work! Just step inside and experience the good life!
Last Agent to Sell the Property
Keller Williams Realty Brokerage Phone: 207-754-4221 Listed on: 09/12/2022

| Date | Buyer | Sale Price | Title Company |
|---|---|---|---|
| Fisher Amy E | $350,000 | None Available |
| Date | Status | Borrower | Loan Amount |
|---|---|---|---|
| Open | Fisher Amy E | $315,000 |
| Date | Event | Price | List to Sale | Price per Sq Ft |
|---|---|---|---|---|
| 11/07/2022 11/07/22 | Sold | $350,000 | -17.6% | $159 / Sq Ft |
| 09/11/2022 09/11/22 | Pending | -- | -- | -- |
| 07/25/2022 07/25/22 | For Sale | $425,000 | -- | $193 / Sq Ft |
| Year | Tax Paid | Tax Assessment Tax Assessment Total Assessment is a certain percentage of the fair market value that is determined by local assessors to be the total taxable value of land and additions on the property. | Land | Improvement |
|---|---|---|---|---|
| 2024 | $3,937 | $330,800 | $72,100 | $258,700 |
| 2023 | $2,884 | $196,200 | $52,500 | $143,700 |
| 2022 | $2,943 | $196,200 | $52,500 | $143,700 |
| 2021 | $3,231 | $181,500 | $52,000 | $129,500 |
| 2020 | $3,176 | $181,500 | $52,000 | $129,500 |
| 2019 | $3,327 | $162,300 | $47,000 | $115,300 |
| 2018 | $3,327 | $162,300 | $47,000 | $115,300 |
| 2017 | $3,327 | $162,300 | $47,000 | $115,300 |
| 2016 | $3,327 | $162,300 | $47,000 | $115,300 |
| 2015 | $3,155 | $155,400 | $47,000 | $108,400 |
| 2014 | $3,030 | $155,400 | $47,000 | $108,400 |
| 2013 | $2,875 | $155,400 | $47,000 | $108,400 |
A
Seller's Agent in 2022
Angela Lee
Keller Williams Realty
(207) 754-4221
138 Total Sales
Buyer's Agent in 2022
Chayann Colby
Maine Country and Coast Real Estate
(207) 877-4103
315 Total Sales
Source: Maine Listings
MLS Number: 1537686
APN: SEAM-000003-000000-000001
Disclaimer: Certain information contained herein is derived from information provided by parties other than Homes.com. All information provided is deemed reliable, but is not guaranteed to be accurate and should be independently verified.
![]() Listing data is derived in whole or in part from Maine Real Estate Information System, Inc. (d/b/a Maine Listings) and is for consumers' personal, noncommercial use only. Dimensions are approximate and not guaranteed. All data should be independently verified.
Listing data is derived in whole or in part from Maine Real Estate Information System, Inc. (d/b/a Maine Listings) and is for consumers' personal, noncommercial use only. Dimensions are approximate and not guaranteed. All data should be independently verified.
© 2025 Maine Real Estate Information System, Inc. All Rights Reserved. Equal Housing Opportunity.
Homes.com, LLC, 17600 Laguna Canyon Rd Irvine, CA 92618 (888)-952-6393
![]()