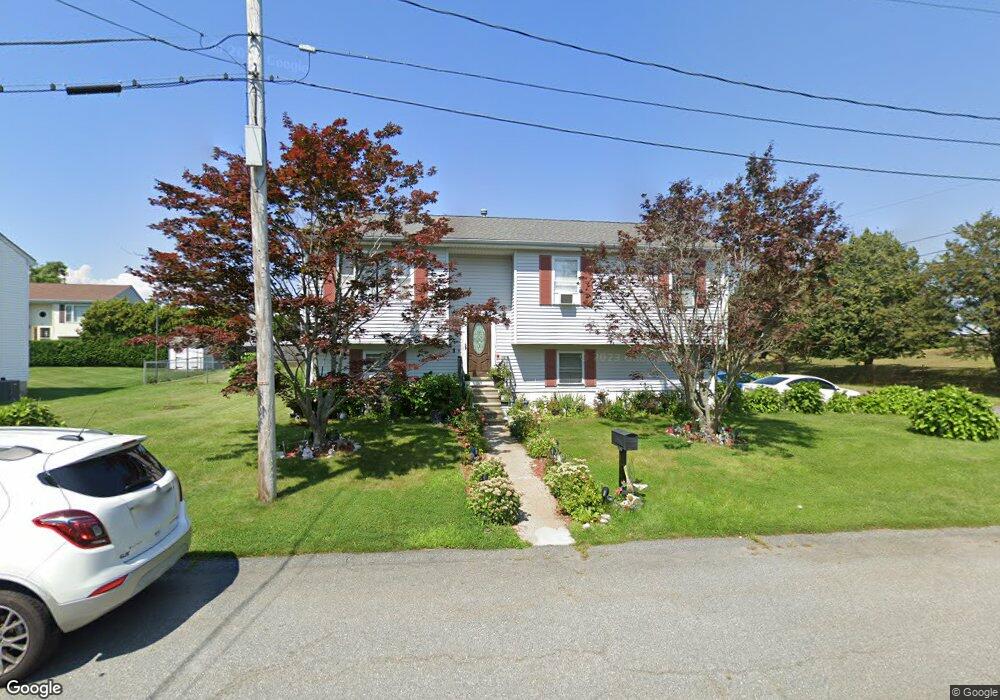
61 Mcmahon St Fall River, MA 02721
Maplewood NeighborhoodEstimated Value: $425,385 - $494,000
3
Beds
2
Baths
1,582
Sq Ft
$292/Sq Ft
Est. Value
About This Home
This home is located at 61 Mcmahon St, Fall River, MA 02721 and is currently estimated at $462,596, approximately $292 per square foot. 61 Mcmahon St is a home located in Bristol County with nearby schools including Henry Lord Community School, B M C Durfee High School, and Argosy Collegiate Charter School.
Ownership History
Date
Name
Owned For
Owner Type
Purchase Details
Closed on
Nov 13, 2015
Sold by
Sousa Joao L and Sousa Alda M
Bought by
Sousa Alda M and Sousa Marilyn
Current Estimated Value
Purchase Details
Closed on
Jul 16, 1996
Sold by
Well Built Homes Inc
Bought by
Sousa Joao L and Sousa Alda M
Home Financials for this Owner
Home Financials are based on the most recent Mortgage that was taken out on this home.
Original Mortgage
$109,250
Interest Rate
7.98%
Mortgage Type
Purchase Money Mortgage
Create a Home Valuation Report for This Property
The Home Valuation Report is an in-depth analysis detailing your home's value as well as a comparison with similar homes in the area
Home Values in the Area
Average Home Value in this Area
Purchase History
| Date | Buyer | Sale Price | Title Company |
|---|---|---|---|
| Sousa Alda M | -- | -- | |
| Sousa Joao L | $115,000 | -- |
Source: Public Records
Mortgage History
| Date | Status | Borrower | Loan Amount |
|---|---|---|---|
| Previous Owner | Sousa Joao L | $85,000 | |
| Previous Owner | Sousa Joao L | $109,250 |
Source: Public Records
Tax History
| Year | Tax Paid | Tax Assessment Tax Assessment Total Assessment is a certain percentage of the fair market value that is determined by local assessors to be the total taxable value of land and additions on the property. | Land | Improvement |
|---|---|---|---|---|
| 2025 | $4,192 | $366,100 | $116,300 | $249,800 |
| 2024 | $3,764 | $327,600 | $114,000 | $213,600 |
| 2023 | $3,779 | $308,000 | $102,700 | $205,300 |
| 2022 | $3,322 | $263,200 | $96,900 | $166,300 |
| 2021 | $3,253 | $235,200 | $92,600 | $142,600 |
| 2020 | $3,167 | $219,200 | $88,400 | $130,800 |
| 2019 | $3,254 | $223,200 | $92,400 | $130,800 |
| 2018 | $3,145 | $215,100 | $93,100 | $122,000 |
| 2017 | $2,997 | $214,100 | $93,100 | $121,000 |
| 2016 | $2,873 | $210,800 | $95,900 | $114,900 |
| 2015 | $2,693 | $205,900 | $95,900 | $110,000 |
| 2014 | $2,590 | $205,900 | $95,900 | $110,000 |
Source: Public Records
Map
Nearby Homes
Your Personal Tour Guide
Ask me questions while you tour the home.