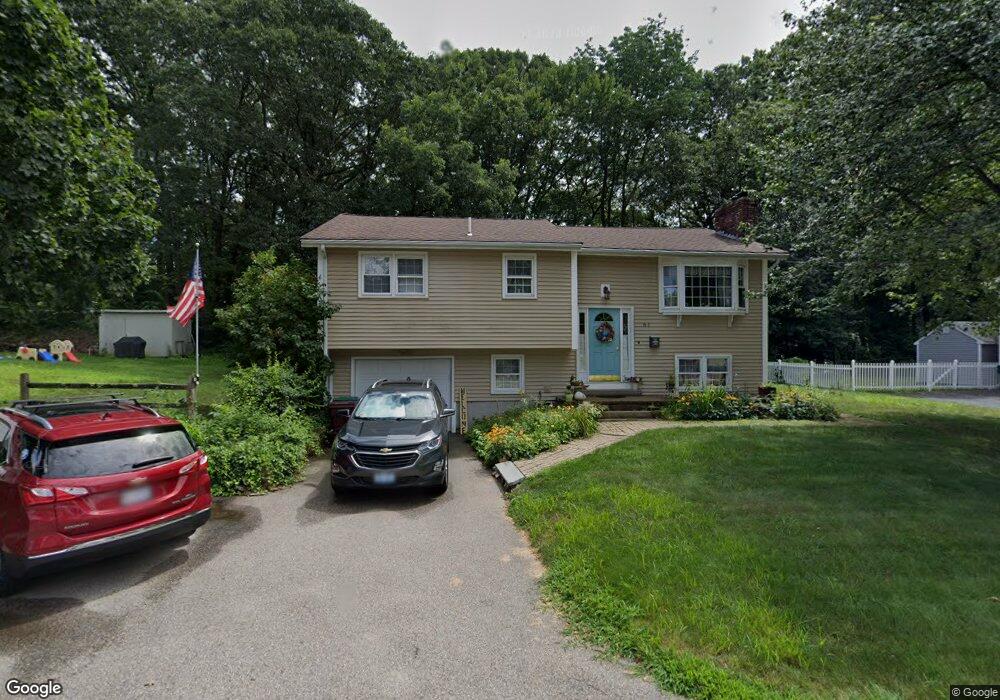
61 Morin St Woonsocket, RI 02895
East Woonsocket NeighborhoodEstimated Value: $408,000 - $458,000
3
Beds
2
Baths
1,333
Sq Ft
$329/Sq Ft
Est. Value
About This Home
This home is located at 61 Morin St, Woonsocket, RI 02895 and is currently estimated at $438,686, approximately $329 per square foot. 61 Morin St is a home located in Providence County with nearby schools including Woonsocket High School and Good Shepherd Catholic School.
Ownership History
Date
Name
Owned For
Owner Type
Purchase Details
Closed on
May 17, 2011
Sold by
Boisvert Ernest S and Boisvert Lorriane M
Bought by
Boisvert Ernest S and Boisvert Lorraine M
Current Estimated Value
Purchase Details
Closed on
Jan 1, 1987
Bought by
Boisvert Ft
Create a Home Valuation Report for This Property
The Home Valuation Report is an in-depth analysis detailing your home's value as well as a comparison with similar homes in the area
Home Values in the Area
Average Home Value in this Area
Purchase History
| Date | Buyer | Sale Price | Title Company |
|---|---|---|---|
| Boisvert Ernest S | -- | -- | |
| Boisvert Ft | -- | -- | |
| Boisvert Ernest S | -- | -- |
Source: Public Records
Mortgage History
| Date | Status | Borrower | Loan Amount |
|---|---|---|---|
| Previous Owner | Boisvert Ft | $63,000 | |
| Previous Owner | Boisvert Ft | $100,000 | |
| Previous Owner | Boisvert Ft | $62,000 |
Source: Public Records
Tax History
| Year | Tax Paid | Tax Assessment Tax Assessment Total Assessment is a certain percentage of the fair market value that is determined by local assessors to be the total taxable value of land and additions on the property. | Land | Improvement |
|---|---|---|---|---|
| 2025 | $4,494 | $400,200 | $106,400 | $293,800 |
| 2024 | $4,289 | $295,000 | $86,800 | $208,200 |
| 2023 | $4,124 | $295,000 | $86,800 | $208,200 |
| 2022 | $4,124 | $295,000 | $86,800 | $208,200 |
| 2021 | $4,764 | $200,600 | $68,900 | $131,700 |
| 2020 | $4,814 | $200,600 | $68,900 | $131,700 |
| 2018 | $4,830 | $200,600 | $68,900 | $131,700 |
| 2017 | $5,376 | $178,600 | $64,400 | $114,200 |
| 2016 | $5,687 | $178,600 | $64,400 | $114,200 |
| 2015 | $6,533 | $178,600 | $64,400 | $114,200 |
| 2014 | $6,541 | $182,000 | $70,800 | $111,200 |
Source: Public Records
Map
Nearby Homes
- 7 Theresa Marie Ave
- 1088 Diamond Hill Rd
- 212 Saint Louis Ave
- 213 St Louis Ave
- 89 Saint Agnes Ave
- 188 Saint Louis Ave
- 178 Saint Louis Ave
- 33 Achille St
- 202 Paine St
- 727 Mendon Rd
- 194 Paine St
- 568 Elm St
- 34 Heroux Ave
- 68 Kenwood St
- 551 Wood Ave
- 538 Wood Ave
- Lot 2 Pulaski Blvd
- 56 Mailloux St
- 90 Mill St Unit 202
- 311 Elm St
Your Personal Tour Guide
Ask me questions while you tour the home.