Estimated Value: $334,000 - $419,000
4
Beds
2
Baths
2,129
Sq Ft
$181/Sq Ft
Est. Value
About This Home
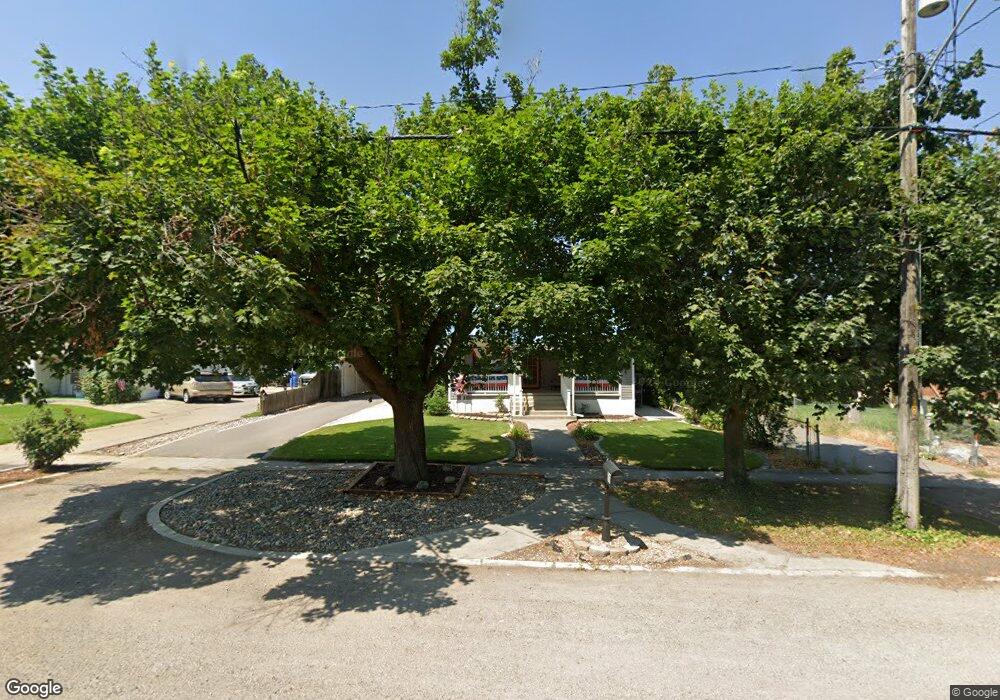
This home is located at 61 N 200 W, Hyrum, UT 84319 and is currently estimated at $385,838, approximately $181 per square foot. 61 N 200 W is a home located in Cache County with nearby schools including Lincoln School, South Cache Middle School, and Mountain Crest High School.
Ownership History
Date
Name
Owned For
Owner Type
Purchase Details
Closed on
Apr 8, 2019
Sold by
Gudmunson Steven G and Gudmunson Julie G
Bought by
Esplin Tim H
Current Estimated Value
Home Financials for this Owner
Home Financials are based on the most recent Mortgage that was taken out on this home.
Original Mortgage
$117,900
Outstanding Balance
$103,230
Interest Rate
4.3%
Mortgage Type
New Conventional
Estimated Equity
$282,608
Purchase Details
Closed on
Dec 21, 2001
Sold by
Hellberg Eric Ray and Hellberg Heather Faye
Bought by
Bickmore Jeffery C and Bickmore Amanda
Create a Home Valuation Report for This Property
The Home Valuation Report is an in-depth analysis detailing your home's value as well as a comparison with similar homes in the area
Home Values in the Area
Average Home Value in this Area
Purchase History
| Date | Buyer | Sale Price | Title Company |
|---|---|---|---|
| Esplin Tim H | -- | Northern Title Company | |
| Bickmore Jeffery C | -- | Pinnacle Title |
Source: Public Records
Mortgage History
| Date | Status | Borrower | Loan Amount |
|---|---|---|---|
| Open | Esplin Tim H | $117,900 |
Source: Public Records
Tax History Compared to Growth
Tax History
| Year | Tax Paid | Tax Assessment Tax Assessment Total Assessment is a certain percentage of the fair market value that is determined by local assessors to be the total taxable value of land and additions on the property. | Land | Improvement |
|---|---|---|---|---|
| 2025 | $1,447 | $207,795 | $0 | $0 |
| 2024 | $16 | $208,635 | $0 | $0 |
| 2023 | $1,561 | $200,075 | $0 | $0 |
| 2022 | $1,815 | $222,990 | $0 | $0 |
| 2021 | $1,648 | $306,510 | $66,200 | $240,310 |
| 2020 | $1,453 | $252,600 | $66,200 | $186,400 |
| 2019 | $986 | $162,496 | $41,900 | $120,596 |
| 2018 | $942 | $149,872 | $41,900 | $107,972 |
| 2017 | $860 | $72,095 | $0 | $0 |
| 2016 | $880 | $72,095 | $0 | $0 |
| 2015 | $882 | $72,095 | $0 | $0 |
| 2014 | $860 | $71,930 | $0 | $0 |
| 2013 | -- | $71,930 | $0 | $0 |
Source: Public Records
Map
Nearby Homes