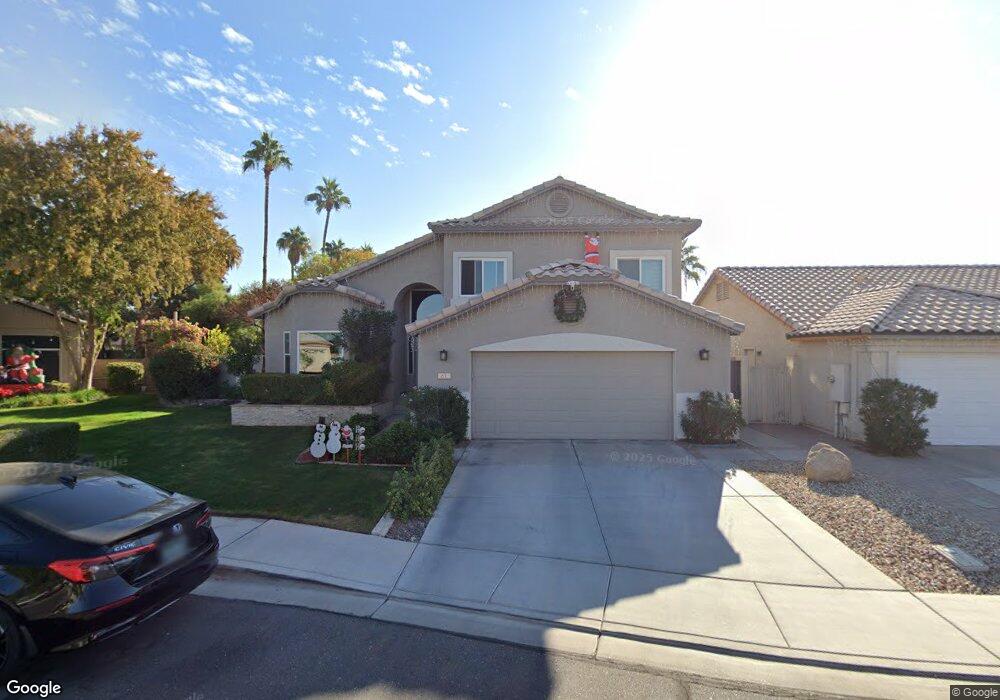
61 N Jentilly Ln Chandler, AZ 85226
West Chandler NeighborhoodEstimated Value: $586,112 - $661,000
--
Bed
4
Baths
2,430
Sq Ft
$259/Sq Ft
Est. Value
About This Home
This home is located at 61 N Jentilly Ln, Chandler, AZ 85226 and is currently estimated at $630,278, approximately $259 per square foot. 61 N Jentilly Ln is a home located in Maricopa County with nearby schools including Kyrene de la Paloma School, Kyrene del Pueblo Middle School, and Corona Del Sol High School.
Ownership History
Date
Name
Owned For
Owner Type
Purchase Details
Closed on
May 5, 2016
Sold by
Lopez Family Living Trust
Bought by
Lopez Family Living Trust and Iker Lopez Regan Elizabeth
Current Estimated Value
Purchase Details
Closed on
Aug 27, 2001
Sold by
Havermann David A and Havermann Shelley J
Bought by
Lopez Rigoberto and Iker Lopez Regan Elizabeth
Home Financials for this Owner
Home Financials are based on the most recent Mortgage that was taken out on this home.
Original Mortgage
$213,000
Interest Rate
7.09%
Mortgage Type
New Conventional
Purchase Details
Closed on
Feb 7, 1995
Sold by
First American Title Insurance Company
Bought by
Havermann David A and Havermann Shelley J
Home Financials for this Owner
Home Financials are based on the most recent Mortgage that was taken out on this home.
Original Mortgage
$125,250
Interest Rate
9.21%
Mortgage Type
New Conventional
Create a Home Valuation Report for This Property
The Home Valuation Report is an in-depth analysis detailing your home's value as well as a comparison with similar homes in the area
Home Values in the Area
Average Home Value in this Area
Purchase History
| Date | Buyer | Sale Price | Title Company |
|---|---|---|---|
| Lopez Family Living Trust | -- | None Available | |
| Lopez Rigoberto | $213,000 | Capital Title Agency | |
| Havermann David A | $139,221 | First American Title |
Source: Public Records
Mortgage History
| Date | Status | Borrower | Loan Amount |
|---|---|---|---|
| Previous Owner | Lopez Rigoberto | $213,000 | |
| Previous Owner | Havermann David A | $125,250 |
Source: Public Records
Tax History Compared to Growth
Tax History
| Year | Tax Paid | Tax Assessment Tax Assessment Total Assessment is a certain percentage of the fair market value that is determined by local assessors to be the total taxable value of land and additions on the property. | Land | Improvement |
|---|---|---|---|---|
| 2025 | $2,530 | $31,758 | -- | -- |
| 2024 | $2,420 | $30,245 | -- | -- |
| 2023 | $2,420 | $46,050 | $9,210 | $36,840 |
| 2022 | $2,303 | $36,460 | $7,290 | $29,170 |
| 2021 | $2,429 | $32,900 | $6,580 | $26,320 |
| 2020 | $2,373 | $31,220 | $6,240 | $24,980 |
| 2019 | $2,304 | $30,270 | $6,050 | $24,220 |
| 2018 | $2,228 | $28,870 | $5,770 | $23,100 |
| 2017 | $2,123 | $27,870 | $5,570 | $22,300 |
| 2016 | $2,167 | $26,920 | $5,380 | $21,540 |
| 2015 | $2,000 | $25,320 | $5,060 | $20,260 |
Source: Public Records
Map
Nearby Homes
- 5143 W Mercury Way
- 4628 W Buffalo St
- 5151 W Glenview Place
- 5137 W Jupiter Way
- 295 N Rural Rd Unit 160
- 295 N Rural Rd Unit 128
- 295 N Rural Rd Unit 202
- 4624 W Chicago St
- 4613 W Chicago St Unit 2
- 4554 W Detroit St
- 5455 W Buffalo St
- 5043 W Whitten St
- 390 N Enterprise Place Unit B37
- 390 N Enterprise Place Unit A6
- 4790 W Geronimo St
- 5361 W Saragosa St
- 5041 W Kesler Ln
- 4650 W Geronimo St
- 4772 W Joshua Blvd
- 5330 W Kesler Ln
- 51 N Jentilly Ln
- 71 N Jentilly Ln
- 4844 W Commonwealth Place
- 4848 W Commonwealth Place
- 4840 W Commonwealth Place
- 4932 W Morgan Dr
- 4943 W Morgan Dr
- 4942 W Morgan Dr
- 4836 W Commonwealth Place
- 4953 W Morgan Dr
- 83 N Tangerine Dr
- 4895 W Buffalo St
- 4905 W Buffalo St
- 4885 W Buffalo St
- 4915 W Buffalo St
- 4843 W Commonwealth Place
- 4847 W Commonwealth Place
- 4963 W Morgan Dr
- 4832 W Commonwealth Place
- 93 N Tangerine Dr