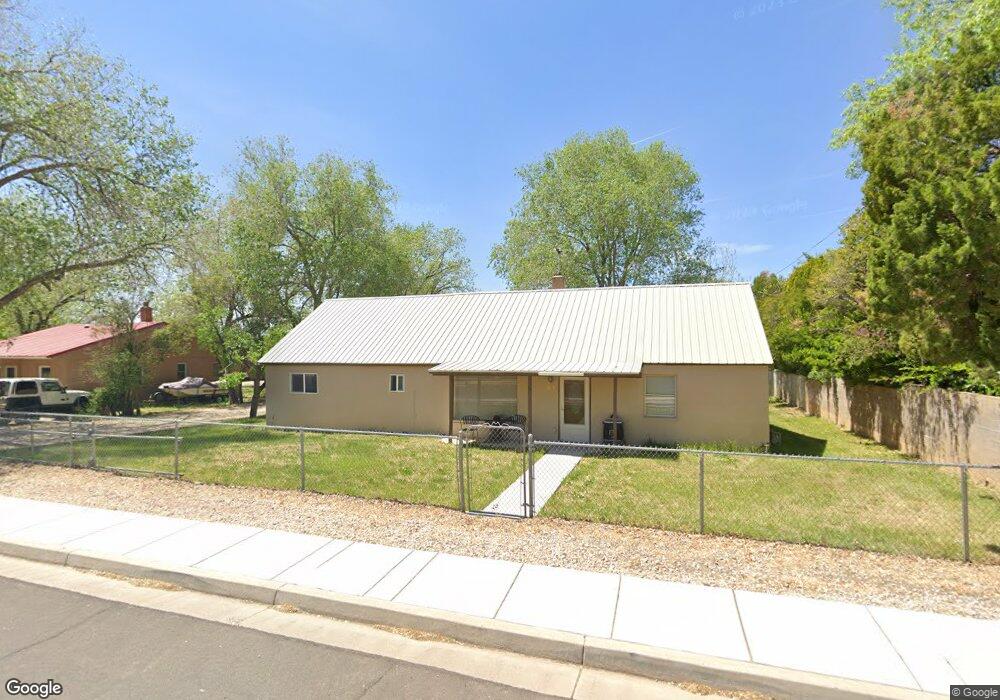
61 N Main St La Verkin, UT 84745
Estimated Value: $348,000 - $513,000
3
Beds
2
Baths
1,904
Sq Ft
$237/Sq Ft
Est. Value
About This Home
This home is located at 61 N Main St, La Verkin, UT 84745 and is currently estimated at $450,937, approximately $236 per square foot. 61 N Main St is a home located in Washington County with nearby schools including La Verkin Elementary School, Hurricane Middle School, and Hurricane High School.
Ownership History
Date
Name
Owned For
Owner Type
Purchase Details
Closed on
Apr 4, 2018
Sold by
Allen Samuel D and Allen Samuel Dean
Bought by
Allen Samuel D and Allen Revocable Livin Samuel D
Current Estimated Value
Purchase Details
Closed on
Aug 22, 2007
Sold by
Allen Deeann B and Allen Dee Ann
Bought by
Allen Samuel Dean
Purchase Details
Closed on
Dec 22, 2006
Sold by
Allen Samuel D
Bought by
Allen Samuel D and Allen Dee Ann
Home Financials for this Owner
Home Financials are based on the most recent Mortgage that was taken out on this home.
Original Mortgage
$135,000
Interest Rate
6.33%
Mortgage Type
New Conventional
Create a Home Valuation Report for This Property
The Home Valuation Report is an in-depth analysis detailing your home's value as well as a comparison with similar homes in the area
Home Values in the Area
Average Home Value in this Area
Purchase History
| Date | Buyer | Sale Price | Title Company |
|---|---|---|---|
| Allen Samuel D | -- | None Available | |
| Allen Samuel Dean | -- | Accommodation | |
| Allen Samuel D | -- | Southern Utah Title Company | |
| Allen Samuel D | -- | Southern Utah Title Co |
Source: Public Records
Mortgage History
| Date | Status | Borrower | Loan Amount |
|---|---|---|---|
| Previous Owner | Allen Samuel D | $135,000 |
Source: Public Records
Tax History Compared to Growth
Tax History
| Year | Tax Paid | Tax Assessment Tax Assessment Total Assessment is a certain percentage of the fair market value that is determined by local assessors to be the total taxable value of land and additions on the property. | Land | Improvement |
|---|---|---|---|---|
| 2025 | $528 | $268,730 | $85,800 | $182,930 |
| 2023 | $534 | $243,760 | $85,800 | $157,960 |
| 2022 | $2,313 | $233,695 | $57,200 | $176,495 |
| 2021 | $1,632 | $299,800 | $78,000 | $221,800 |
| 2020 | $746 | $256,400 | $78,000 | $178,400 |
| 2019 | $1,254 | $206,500 | $50,000 | $156,500 |
| 2018 | $1,189 | $96,415 | $0 | $0 |
| 2017 | $1,135 | $92,070 | $0 | $0 |
| 2016 | $1,090 | $84,865 | $0 | $0 |
| 2015 | $517 | $77,385 | $0 | $0 |
| 2014 | $956 | $70,565 | $0 | $0 |
Source: Public Records
Map
Nearby Homes
- 80 W Center St Unit 13
- 728 N 15 W
- 163 N 70 E
- 200 N State St
- 0 Lot #1 Valle Vista Unit 25-262463
- 65 S Main St
- 161 E 130 N
- 0 Lot #4 Valle Vista Unit 25-262467
- 233 N State St
- 0 Lot #2 Valle Vista Unit 25-262464
- 0 Vista Unit 25-262466
- 31 Webb
- 235 N 200 E
- 235 N 200 E Unit 55
- 237 N 220 W
- 140 S 100 W
- 24 Wanda
- 39 W 380 N
- 385 N 100 E
- 57 W 180 S