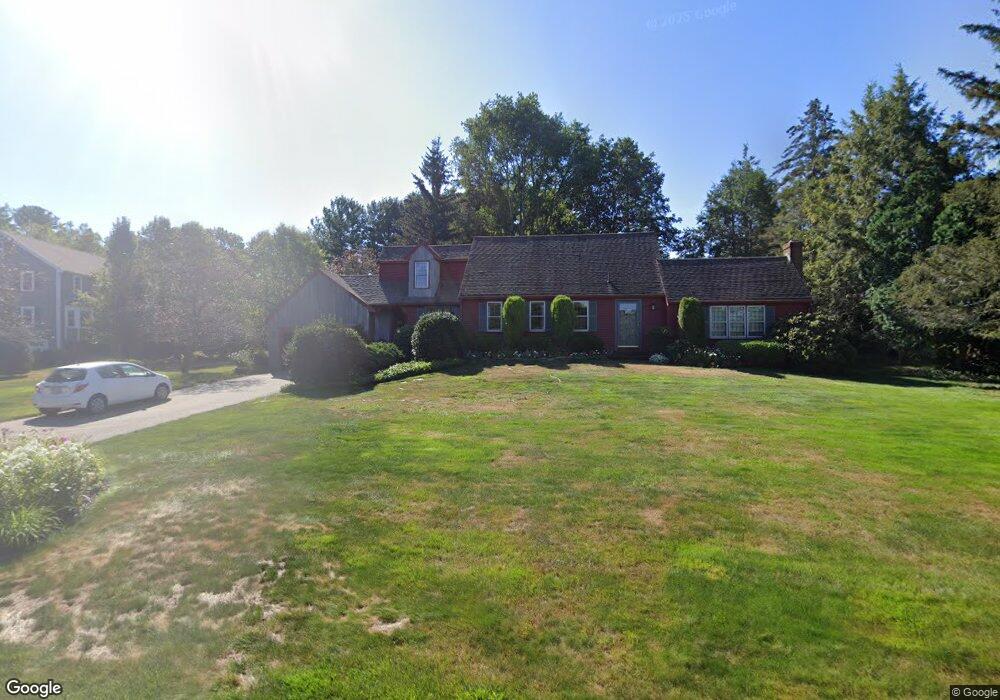
61 Old Bridge Rd Hanover, MA 02339
Estimated Value: $832,402 - $982,000
3
Beds
2
Baths
1,983
Sq Ft
$465/Sq Ft
Est. Value
About This Home
This home is located at 61 Old Bridge Rd, Hanover, MA 02339 and is currently estimated at $921,351, approximately $464 per square foot. 61 Old Bridge Rd is a home located in Plymouth County with nearby schools including Hanover High School, Cadence Academy Preschool - Hanover, and The Master's Academy.
Ownership History
Date
Name
Owned For
Owner Type
Purchase Details
Closed on
May 22, 2019
Sold by
Sigsby Ava T
Bought by
Ava T Sigsby 2019 Irt
Current Estimated Value
Purchase Details
Closed on
Aug 13, 2007
Sold by
Sigsby Robert D and Sigsby Ava T
Bought by
Sigsby Tr Robert D and Sigsby Ava T
Create a Home Valuation Report for This Property
The Home Valuation Report is an in-depth analysis detailing your home's value as well as a comparison with similar homes in the area
Home Values in the Area
Average Home Value in this Area
Purchase History
| Date | Buyer | Sale Price | Title Company |
|---|---|---|---|
| Ava T Sigsby 2019 Irt | -- | -- | |
| Robert D Sigsby 2019 Irt | -- | -- | |
| Sigsby Robert D | -- | -- | |
| Sigsby Tr Robert D | -- | -- |
Source: Public Records
Mortgage History
| Date | Status | Borrower | Loan Amount |
|---|---|---|---|
| Previous Owner | Sigsby Tr Robert D | $30,000 | |
| Previous Owner | Sigsby Tr Robert D | $15,000 |
Source: Public Records
Tax History
| Year | Tax Paid | Tax Assessment Tax Assessment Total Assessment is a certain percentage of the fair market value that is determined by local assessors to be the total taxable value of land and additions on the property. | Land | Improvement |
|---|---|---|---|---|
| 2025 | $9,016 | $730,000 | $323,600 | $406,400 |
| 2024 | $8,793 | $684,800 | $323,600 | $361,200 |
| 2023 | $8,492 | $629,500 | $294,100 | $335,400 |
| 2022 | $8,615 | $564,900 | $269,600 | $295,300 |
| 2021 | $8,657 | $530,100 | $245,000 | $285,100 |
| 2020 | $8,564 | $525,100 | $245,000 | $280,100 |
| 2019 | $8,367 | $509,900 | $267,300 | $242,600 |
| 2018 | $8,132 | $499,500 | $256,200 | $243,300 |
| 2017 | $7,639 | $462,400 | $252,000 | $210,400 |
| 2016 | $7,656 | $454,100 | $238,700 | $215,400 |
| 2015 | $7,019 | $434,600 | $229,200 | $205,400 |
Source: Public Records
Map
Nearby Homes
- 26 Church St
- 365 Broadway
- 172 Washington St
- 75 Masthead Dr
- 33 1st Parish Ln
- 261 Washington St
- 70 Bardin St
- 269 Washington St Unit C3
- 68 East St
- 35 Sproul Rd
- 422 River St
- 60 Summer Path Way
- 7 Farmside Dr
- 285 W Elm St
- 51 Farmside Dr
- 33 Barker Square Dr Unit 33
- 114 Graham Hill Dr
- 8 Quaker Cir
- 23 John Neil Dr
- 7 Spring St
- 8 Old Shipyard Ln
- 77 Old Bridge Rd
- 0 Old Shipyard Ln
- 48 Old Bridge Rd
- 96 Old Bridge Rd
- 94 Old Bridge Rd
- 1 Old Shipyard Ln
- 7 Old Shipyard Ln
- 38 Old Bridge Rd
- 38 Old Bridge Rd Unit 1
- 88 Old Bridge Rd
- 38 Old Shipyard Ln
- 35 Old Shipyard Ln
- 71 Washington St
- 19 Old Bridge Rd
- 32 Old Bridge Rd
- 32 Old Bridge Rd Unit 1
- 48 Old Shipyard Ln
- 69 Washington St
- 14 Old Bridge Rd
Your Personal Tour Guide
Ask me questions while you tour the home.