L
Landlord's Agent in 2023
Lana Tran
LT Realty
(617) 818-3889
5 Total Sales
Estimated Value: $552,000 - $571,995
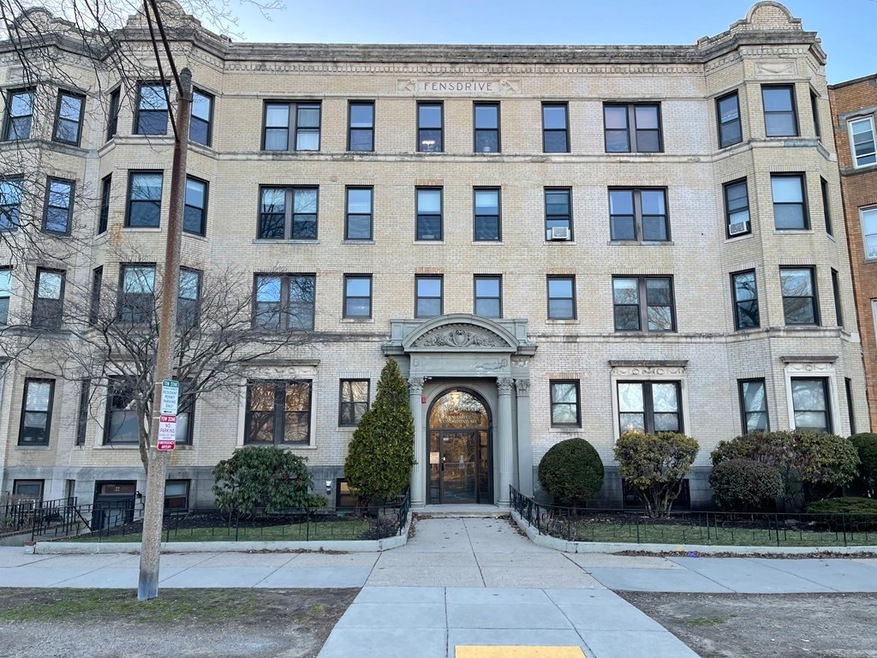
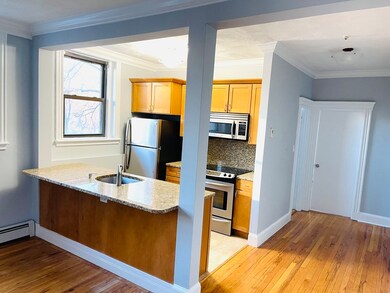
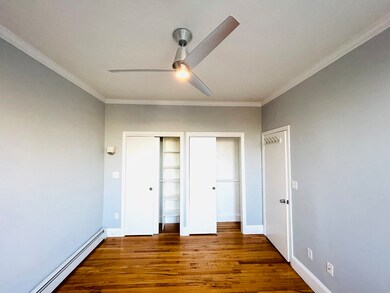
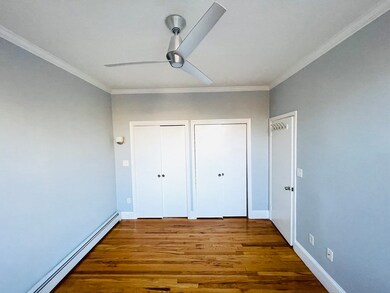
Nice brick building in Fenway that Hub Realty has been renting for over 30 years!
| Date | Buyer | Sale Price | Title Company |
|---|---|---|---|
| Than Vinnle B | $415,000 | -- | |
| Pacowski Alain | -- | -- | |
| Hassman David | $272,950 | -- | |
| Bacowski Alain | $129,000 | -- |
| Date | Status | Borrower | Loan Amount |
|---|---|---|---|
| Previous Owner | Hassman David | $218,360 | |
| Previous Owner | Bacowski Alain | $64,500 |
| Date | Event | Price | List to Sale | Price per Sq Ft | Prior Sale |
|---|---|---|---|---|---|
| 08/24/2025 08/24/25 | Off Market | $3,495 | -- | -- | |
| 08/05/2025 08/05/25 | Price Changed | $3,495 | -10.3% | $9 / Sq Ft | |
| 07/24/2025 07/24/25 | Price Changed | $3,895 | -2.5% | $10 / Sq Ft | |
| 07/22/2025 07/22/25 | Price Changed | $3,995 | -4.8% | $11 / Sq Ft | |
| 07/15/2025 07/15/25 | Price Changed | $4,195 | +100.2% | $11 / Sq Ft | |
| 07/01/2025 07/01/25 | Price Changed | $2,095 | +5.0% | $6 / Sq Ft | |
| 06/11/2025 06/11/25 | Price Changed | $1,995 | -11.3% | $5 / Sq Ft | |
| 04/22/2025 04/22/25 | Price Changed | $2,250 | -5.3% | $6 / Sq Ft | |
| 03/20/2025 03/20/25 | Price Changed | $2,375 | -0.8% | $6 / Sq Ft | |
| 03/13/2025 03/13/25 | For Rent | $2,395 | 0.0% | -- | |
| 03/08/2025 03/08/25 | Off Market | $2,395 | -- | -- | |
| 02/04/2025 02/04/25 | For Rent | $2,395 | 0.0% | -- | |
| 02/04/2025 02/04/25 | Price Changed | $2,395 | +0.8% | $6 / Sq Ft | |
| 12/13/2024 12/13/24 | Off Market | $2,375 | -- | -- | |
| 12/06/2024 12/06/24 | For Rent | $2,375 | 0.0% | -- | |
| 12/06/2024 12/06/24 | Price Changed | $2,375 | +4.4% | $6 / Sq Ft | |
| 11/10/2024 11/10/24 | Off Market | $2,275 | -- | -- | |
| 10/23/2024 10/23/24 | Price Changed | $2,275 | +3.6% | $6 / Sq Ft | |
| 10/15/2024 10/15/24 | For Rent | $2,195 | 0.0% | -- | |
| 10/15/2024 10/15/24 | Price Changed | $2,195 | -13.9% | $6 / Sq Ft | |
| 10/01/2024 10/01/24 | For Rent | $2,550 | -8.9% | -- | |
| 08/31/2023 08/31/23 | Rented | $2,800 | 0.0% | -- | |
| 08/26/2023 08/26/23 | Under Contract | -- | -- | -- | |
| 08/21/2023 08/21/23 | For Rent | $2,800 | 0.0% | -- | |
| 07/05/2013 07/05/13 | Sold | $415,000 | -2.4% | $692 / Sq Ft | View Prior Sale |
| 05/21/2013 05/21/13 | Pending | -- | -- | -- | |
| 05/17/2013 05/17/13 | For Sale | $425,000 | -- | $708 / Sq Ft |
| Year | Tax Paid | Tax Assessment Tax Assessment Total Assessment is a certain percentage of the fair market value that is determined by local assessors to be the total taxable value of land and additions on the property. | Land | Improvement |
|---|---|---|---|---|
| 2025 | $5,811 | $501,800 | $0 | $501,800 |
| 2024 | $5,421 | $497,300 | $0 | $497,300 |
| 2023 | $5,181 | $482,400 | $0 | $482,400 |
| 2022 | $5,147 | $473,100 | $0 | $473,100 |
| 2021 | $4,950 | $463,900 | $0 | $463,900 |
| 2020 | $5,105 | $483,400 | $0 | $483,400 |
| 2019 | $4,764 | $452,000 | $0 | $452,000 |
| 2018 | $4,387 | $418,600 | $0 | $418,600 |
| 2017 | $4,219 | $398,400 | $0 | $398,400 |
| 2016 | $4,175 | $379,500 | $0 | $379,500 |
| 2015 | $4,005 | $330,700 | $0 | $330,700 |
| 2014 | $3,243 | $257,800 | $0 | $257,800 |
L
Landlord's Agent in 2023
Lana Tran
LT Realty
(617) 818-3889
5 Total Sales

Tenant's Agent in 2023
Paul Coleman
Lamacchia Realty, Inc.
(857) 998-9623
149 Total Sales
D
Seller's Agent in 2013
David Hassman
Boston Property Services, LLC
(617) 697-8701
8 Total Sales
Buyer's Agent in 2013
John Lynch
Dwell360
(617) 299-0012
133 Total Sales
Source: MLS Property Information Network (MLS PIN)
MLS Number: 73150616
APN: CBOS-000000-000005-004252-000020
Disclaimer: Certain information contained herein is derived from information provided by parties other than Homes.com. All information provided is deemed reliable, but is not guaranteed to be accurate and should be independently verified.
![]() The property listing data and information, or the Images, set forth herein were provided to MLS Property Information Network, Inc. from third party sources, including sellers, lessors and public records, and were compiled by MLS Property Information Network, Inc. The property listing data and information, and the Images, are for the personal, non-commercial use of consumers having a good faith interest in purchasing or leasing listed properties of the type displayed to them and may not be used for any purpose other than to identify prospective properties which such consumers may have a good faith interest in purchasing or leasing. MLS Property Information Network, Inc. and its subscribers disclaim any and all representations and warranties as to the accuracy of the property listing data and information, or as to the accuracy of any of the Images, set forth herein.
The property listing data and information, or the Images, set forth herein were provided to MLS Property Information Network, Inc. from third party sources, including sellers, lessors and public records, and were compiled by MLS Property Information Network, Inc. The property listing data and information, and the Images, are for the personal, non-commercial use of consumers having a good faith interest in purchasing or leasing listed properties of the type displayed to them and may not be used for any purpose other than to identify prospective properties which such consumers may have a good faith interest in purchasing or leasing. MLS Property Information Network, Inc. and its subscribers disclaim any and all representations and warranties as to the accuracy of the property listing data and information, or as to the accuracy of any of the Images, set forth herein.