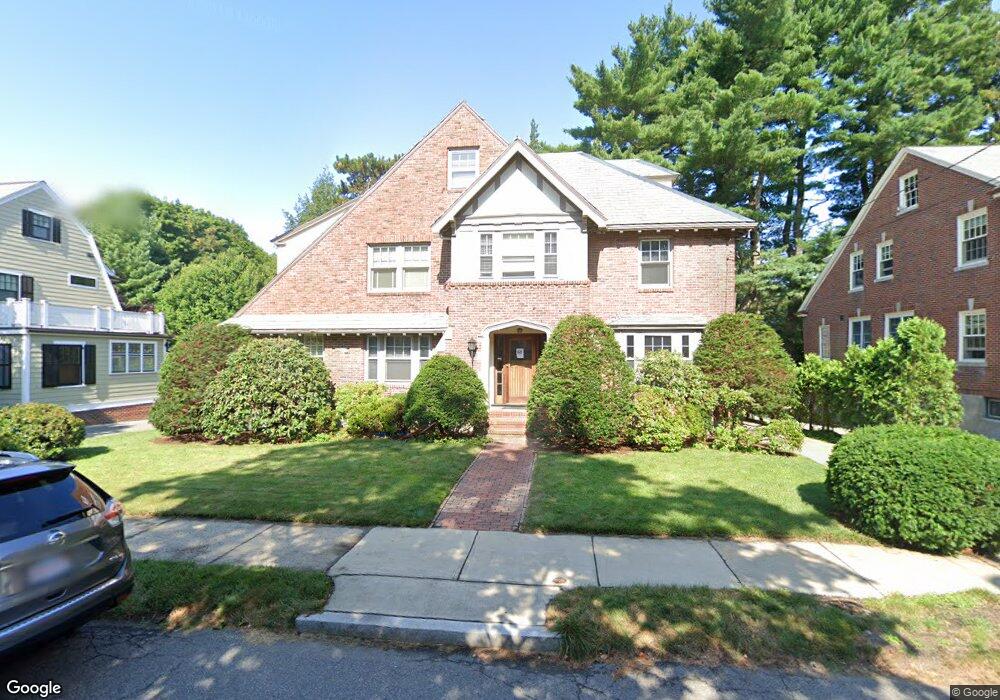
61 Prentice Rd Newton Center, MA 02459
Newton Centre NeighborhoodEstimated Value: $2,027,000 - $2,304,000
4
Beds
4
Baths
3,023
Sq Ft
$731/Sq Ft
Est. Value
About This Home
This home is located at 61 Prentice Rd, Newton Center, MA 02459 and is currently estimated at $2,210,781, approximately $731 per square foot. 61 Prentice Rd is a home located in Middlesex County with nearby schools including Ward Elementary School, Bigelow Middle School, and Newton North High School.
Ownership History
Date
Name
Owned For
Owner Type
Purchase Details
Closed on
Jun 30, 1997
Sold by
Tazbek Edward J and Gonyaw Lillian J
Bought by
Robins Steven N and Robins Jeri N
Current Estimated Value
Home Financials for this Owner
Home Financials are based on the most recent Mortgage that was taken out on this home.
Original Mortgage
$428,800
Interest Rate
7.81%
Mortgage Type
Purchase Money Mortgage
Create a Home Valuation Report for This Property
The Home Valuation Report is an in-depth analysis detailing your home's value as well as a comparison with similar homes in the area
Home Values in the Area
Average Home Value in this Area
Purchase History
| Date | Buyer | Sale Price | Title Company |
|---|---|---|---|
| Robins Steven N | $536,000 | -- |
Source: Public Records
Mortgage History
| Date | Status | Borrower | Loan Amount |
|---|---|---|---|
| Open | Robins Steven N | $352,700 | |
| Closed | Robins Steven N | $425,000 | |
| Closed | Robins Steven N | $428,800 |
Source: Public Records
Tax History
| Year | Tax Paid | Tax Assessment Tax Assessment Total Assessment is a certain percentage of the fair market value that is determined by local assessors to be the total taxable value of land and additions on the property. | Land | Improvement |
|---|---|---|---|---|
| 2025 | $17,769 | $1,813,200 | $1,642,100 | $171,100 |
| 2024 | $17,182 | $1,760,400 | $1,594,300 | $166,100 |
| 2023 | $16,680 | $1,638,500 | $1,220,700 | $417,800 |
| 2022 | $15,960 | $1,517,100 | $1,130,300 | $386,800 |
| 2021 | $15,400 | $1,431,200 | $1,066,300 | $364,900 |
| 2020 | $14,942 | $1,431,200 | $1,066,300 | $364,900 |
| 2019 | $14,520 | $1,389,500 | $1,035,200 | $354,300 |
| 2018 | $14,121 | $1,305,100 | $946,200 | $358,900 |
| 2017 | $13,691 | $1,231,200 | $892,600 | $338,600 |
| 2016 | $13,095 | $1,150,700 | $834,200 | $316,500 |
| 2015 | $12,485 | $1,075,400 | $779,600 | $295,800 |
Source: Public Records
Map
Nearby Homes
- 21 Francis St Unit 21A
- 34 Chestnut Terrace
- 19 Chestnut Terrace
- 53 Marshall St
- 20 Rice St
- 158 Langley Rd Unit 158
- 33 George St Unit 33
- 35 George St Unit 35
- 37 George St Unit 37
- 3 Cedar St
- 642 Centre St
- 26 Knowles St
- 106 Farlow Rd
- 73 Herrick Rd
- 39 Commonwealth Ave Unit 31
- 60 Chapin Rd
- 27-29 Commonwealth Ave Unit 9
- 8 Bennington St
- 269 Franklin St
- 929 Beacon St
Your Personal Tour Guide
Ask me questions while you tour the home.