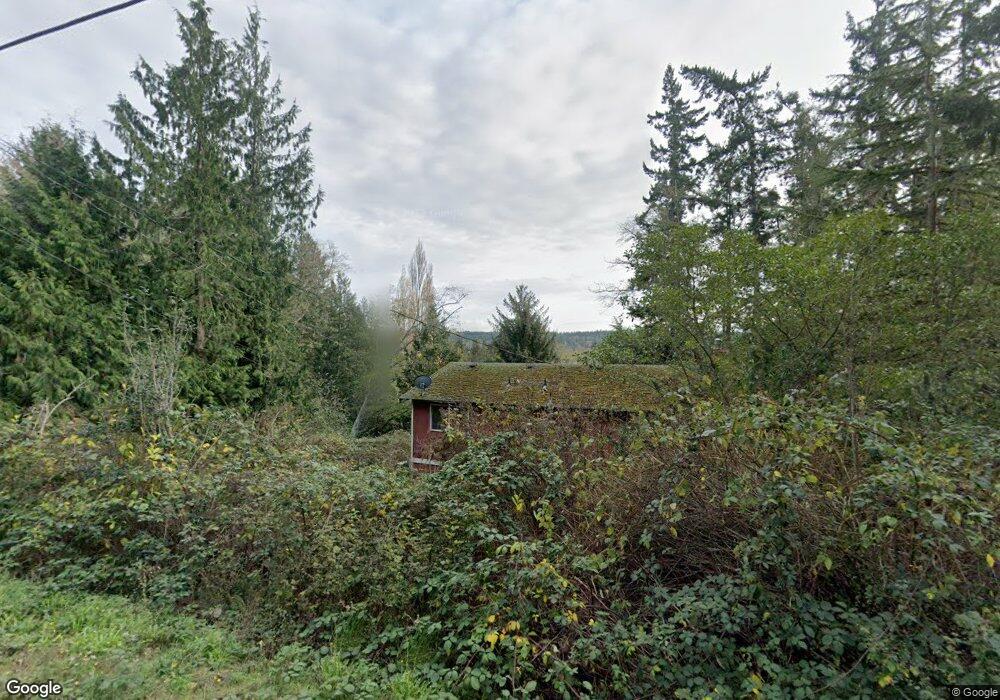
61 Red Cedar Ln Oak Harbor, WA 98277
Estimated Value: $372,000 - $487,000
3
Beds
2
Baths
1,348
Sq Ft
$325/Sq Ft
Est. Value
About This Home
This home is located at 61 Red Cedar Ln, Oak Harbor, WA 98277 and is currently estimated at $437,651, approximately $324 per square foot. 61 Red Cedar Ln is a home located in Island County with nearby schools including Crescent Harbor Elementary School, North Whidbey Middle School, and Oak Harbor High School.
Ownership History
Date
Name
Owned For
Owner Type
Purchase Details
Closed on
Jul 17, 2007
Sold by
Luster James D and Luster Linda K
Bought by
Furukawa Crosby Steven Lee and Furukawa Crosby Akiko
Current Estimated Value
Home Financials for this Owner
Home Financials are based on the most recent Mortgage that was taken out on this home.
Original Mortgage
$239,993
Outstanding Balance
$149,378
Interest Rate
6.51%
Mortgage Type
Purchase Money Mortgage
Estimated Equity
$288,273
Purchase Details
Closed on
Nov 22, 2006
Sold by
Luster James D
Bought by
Luster James D and Luster Linda K
Home Financials for this Owner
Home Financials are based on the most recent Mortgage that was taken out on this home.
Original Mortgage
$186,900
Interest Rate
6.37%
Mortgage Type
New Conventional
Create a Home Valuation Report for This Property
The Home Valuation Report is an in-depth analysis detailing your home's value as well as a comparison with similar homes in the area
Purchase History
| Date | Buyer | Sale Price | Title Company |
|---|---|---|---|
| Furukawa Crosby Steven Lee | $232,000 | Chicago Title Co Island Div | |
| Luster James D | -- | Lt |
Source: Public Records
Mortgage History
| Date | Status | Borrower | Loan Amount |
|---|---|---|---|
| Open | Furukawa Crosby Steven Lee | $239,993 | |
| Previous Owner | Luster James D | $186,900 |
Source: Public Records
Tax History
| Year | Tax Paid | Tax Assessment Tax Assessment Total Assessment is a certain percentage of the fair market value that is determined by local assessors to be the total taxable value of land and additions on the property. | Land | Improvement |
|---|---|---|---|---|
| 2025 | $2,771 | $380,647 | $210,000 | $170,647 |
| 2024 | $2,773 | $386,869 | $210,000 | $176,869 |
| 2023 | $2,773 | $389,538 | $210,000 | $179,538 |
| 2022 | $2,984 | $364,998 | $200,000 | $164,998 |
| 2021 | $2,846 | $285,577 | $140,000 | $145,577 |
| 2020 | $2,758 | $271,900 | $130,000 | $141,900 |
| 2019 | $2,391 | $265,477 | $165,000 | $100,477 |
| 2018 | $2,391 | $250,828 | $150,000 | $100,828 |
| 2017 | $2,049 | $221,532 | $120,000 | $101,532 |
| 2016 | $1,984 | $202,382 | $100,000 | $102,382 |
| 2015 | -- | $188,846 | $85,000 | $103,846 |
| 2013 | -- | $179,021 | $72,250 | $106,771 |
Source: Public Records
Map
Nearby Homes
- 0 W Frostad Rd
- 0 XXX Seahorse Ln
- 453 E Jackrabbit Ln
- 0 Monkey Hill Rd
- 542 Dugualla Rd
- 539 Birch St
- 222 Moonstone Place
- 546 Birch St
- 4522 Monkey Hill Rd
- 4 E Maplewood Loop
- 3812 Emory Trail
- 4357 Hunter Ln
- 3475 Appian Way
- 4486 Villarreal Ln
- 710 E Bay Front Ln
- 570 Ocean View Dr
- 4117 Degraff Rd
- 4251 Hollydale Ln
- 3234 Whitney Dr
- 0 Anglers Haven Dr Unit NWM2480250
- 52 Red Cedar Ln
- 72 Red Cedar Ln
- 4119 Noble Place
- 4135 Balsam Place
- 4117 Noble Place
- 38 Red Cedar Ln
- 4140 Balsam Place
- 4121 Noble Place
- 4125 Balsam Place
- 4124 Jones Rd
- 4129 Noble Place
- 4146 Balsam Place
- 4143 Noble Place
- 4108 Noble Place
- 4142 Kimberly Way
- 4153 Balsam Place
- 4146 Kimberly Way
- 4146 Kimberly Way Unit D
- 4146 Kimberly Way Unit C
Your Personal Tour Guide
Ask me questions while you tour the home.