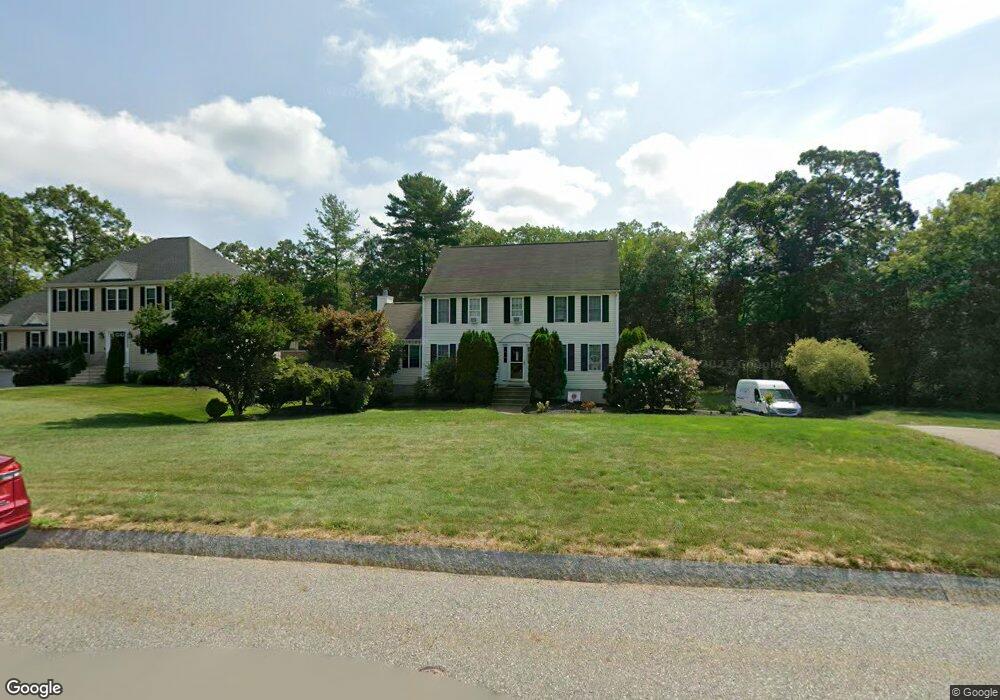
61 Red Oak Rd North Attleboro, MA 02760
North Attleboro NeighborhoodEstimated Value: $732,585 - $846,000
4
Beds
3
Baths
2,106
Sq Ft
$365/Sq Ft
Est. Value
About This Home
This home is located at 61 Red Oak Rd, North Attleboro, MA 02760 and is currently estimated at $768,146, approximately $364 per square foot. 61 Red Oak Rd is a home located in Bristol County with nearby schools including North Attleboro High School, Cadence Academy Preschool - North Attleborough, and Bishop Feehan High School.
Ownership History
Date
Name
Owned For
Owner Type
Purchase Details
Closed on
Sep 15, 2008
Sold by
Ravichanthira Mahadeva M
Bought by
Oram Amy C and Oram William J
Current Estimated Value
Home Financials for this Owner
Home Financials are based on the most recent Mortgage that was taken out on this home.
Original Mortgage
$348,000
Interest Rate
6.58%
Mortgage Type
Purchase Money Mortgage
Purchase Details
Closed on
Jun 28, 2001
Sold by
Ambion Jason
Bought by
Ravichanthira Mahedeva and Ravichanthir Shiyamala
Purchase Details
Closed on
Jul 20, 2000
Sold by
Grier Christopher C and Grier Paige B
Bought by
Ambion Jason
Purchase Details
Closed on
Feb 8, 2000
Sold by
Cobblestone Bldrs Inc
Bought by
Landry Ave Rt and Marguerite Patrick
Create a Home Valuation Report for This Property
The Home Valuation Report is an in-depth analysis detailing your home's value as well as a comparison with similar homes in the area
Home Values in the Area
Average Home Value in this Area
Purchase History
| Date | Buyer | Sale Price | Title Company |
|---|---|---|---|
| Oram Amy C | $435,000 | -- | |
| Ravichanthira Mahedeva | $323,000 | -- | |
| Ambion Jason | $311,000 | -- | |
| Landry Ave Rt | $50,000 | -- |
Source: Public Records
Mortgage History
| Date | Status | Borrower | Loan Amount |
|---|---|---|---|
| Open | Landry Ave Rt | $350,000 | |
| Closed | Oram Amy C | $348,000 | |
| Previous Owner | Landry Ave Rt | $260,000 | |
| Previous Owner | Landry Ave Rt | $260,000 |
Source: Public Records
Tax History Compared to Growth
Tax History
| Year | Tax Paid | Tax Assessment Tax Assessment Total Assessment is a certain percentage of the fair market value that is determined by local assessors to be the total taxable value of land and additions on the property. | Land | Improvement |
|---|---|---|---|---|
| 2025 | $7,079 | $600,400 | $162,100 | $438,300 |
| 2024 | $7,049 | $610,800 | $162,100 | $448,700 |
| 2023 | $6,895 | $539,100 | $169,100 | $370,000 |
| 2022 | $6,461 | $463,800 | $162,100 | $301,700 |
| 2021 | $6,286 | $440,500 | $162,100 | $278,400 |
| 2020 | $6,206 | $432,500 | $162,100 | $270,400 |
| 2019 | $6,039 | $424,100 | $147,400 | $276,700 |
| 2018 | $5,440 | $407,800 | $147,400 | $260,400 |
| 2017 | $5,391 | $407,800 | $147,400 | $260,400 |
| 2016 | $5,447 | $412,000 | $171,000 | $241,000 |
| 2015 | $5,322 | $405,000 | $178,200 | $226,800 |
| 2014 | $5,072 | $383,100 | $156,300 | $226,800 |
Source: Public Records
Map
Nearby Homes
- 11 Landry Ave
- 10 Sleepy Hollow Cir
- 57 Vine St
- 16 Raymond Hall Dr
- 115 Westfield Dr
- Lot 5 Jeffrey Dr
- Lot 2 Jeffrey Dr
- 15 Old Wood Rd
- 116 George St
- 11 Buckthorn Ln
- 36 Cranberry Rd
- 17 Peters Way
- 12 Houde St
- 122 Mary Ann Way
- 59 Laurelwood Dr
- 546 Towne St
- 47 Old Farm Rd
- 1730 West St
- 3 Serengeti Dr
- 2 George St Unit C
- 67 Red Oak Rd
- 51 Red Oak Rd
- 52 Red Oak Rd
- 60 Red Oak Rd
- 42 Red Oak Rd
- 41 Red Oak Rd
- 35 Harold k Waterson Ln
- 49 Harold k Waterson Ln
- 10 White Oak Way
- 32 Red Oak Rd
- 57 Harold k Waterson Ln
- 12 White Oak Way
- 22 White Oak Way
- 22 White Oak Way Unit 22
- 27 Harold k Waterson Ln
- 22 Red Oak Rd
- 1 White Oak Way
- 46 Harold k Waterson Ln
- 34 Harold k Waterson Ln
- 60 Harold k Waterson Ln