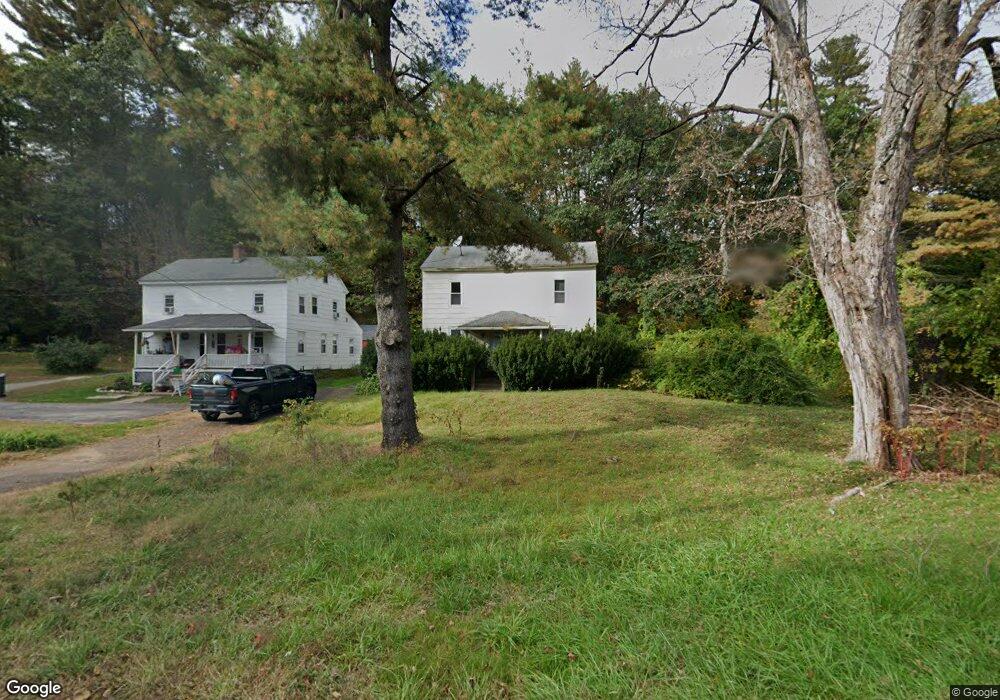
61 Reservoir Rd New Hartford, CT 06057
Estimated Value: $298,689 - $333,000
3
Beds
2
Baths
1,536
Sq Ft
$205/Sq Ft
Est. Value
About This Home
This home is located at 61 Reservoir Rd, New Hartford, CT 06057 and is currently estimated at $314,422, approximately $204 per square foot. 61 Reservoir Rd is a home located in Litchfield County with nearby schools including Ann Antolini School, Northwestern Regional Middle School, and Northwestern Regional High School.
Ownership History
Date
Name
Owned For
Owner Type
Purchase Details
Closed on
Jan 23, 2014
Sold by
Carlin Lauren
Bought by
Carlin 3Rd Charles F
Current Estimated Value
Purchase Details
Closed on
Jun 4, 2007
Sold by
Chesney Sally
Bought by
Carlin 3Rd Charles F and Carlin Lauren I
Home Financials for this Owner
Home Financials are based on the most recent Mortgage that was taken out on this home.
Original Mortgage
$237,276
Interest Rate
6.24%
Purchase Details
Closed on
Nov 22, 2004
Sold by
Burke Brian M
Bought by
Chesney Sally
Home Financials for this Owner
Home Financials are based on the most recent Mortgage that was taken out on this home.
Original Mortgage
$182,400
Interest Rate
4.25%
Purchase Details
Closed on
Jun 7, 2001
Sold by
Est Bombara Louis G and Bombara David J
Bought by
Burke Brian M
Create a Home Valuation Report for This Property
The Home Valuation Report is an in-depth analysis detailing your home's value as well as a comparison with similar homes in the area
Home Values in the Area
Average Home Value in this Area
Purchase History
| Date | Buyer | Sale Price | Title Company |
|---|---|---|---|
| Carlin 3Rd Charles F | -- | -- | |
| Carlin 3Rd Charles F | $241,000 | -- | |
| Chesney Sally | $228,000 | -- | |
| Burke Brian M | $120,000 | -- |
Source: Public Records
Mortgage History
| Date | Status | Borrower | Loan Amount |
|---|---|---|---|
| Previous Owner | Burke Brian M | $238,086 | |
| Previous Owner | Burke Brian M | $237,276 | |
| Previous Owner | Burke Brian M | $182,400 |
Source: Public Records
Tax History Compared to Growth
Tax History
| Year | Tax Paid | Tax Assessment Tax Assessment Total Assessment is a certain percentage of the fair market value that is determined by local assessors to be the total taxable value of land and additions on the property. | Land | Improvement |
|---|---|---|---|---|
| 2025 | $3,888 | $136,570 | $43,540 | $93,030 |
| 2024 | $3,562 | $130,270 | $43,540 | $86,730 |
| 2023 | $3,543 | $107,310 | $54,390 | $52,920 |
| 2022 | $3,327 | $102,970 | $54,390 | $48,580 |
| 2021 | $3,360 | $102,970 | $54,390 | $48,580 |
| 2020 | $3,329 | $102,970 | $54,390 | $48,580 |
| 2019 | $3,290 | $102,970 | $54,390 | $48,580 |
| 2018 | $3,771 | $116,690 | $54,390 | $62,300 |
| 2017 | $3,643 | $116,690 | $54,390 | $62,300 |
| 2016 | $3,631 | $116,690 | $54,390 | $62,300 |
| 2015 | $3,447 | $116,690 | $54,390 | $62,300 |
| 2014 | $3,347 | $116,690 | $54,390 | $62,300 |
Source: Public Records
Map
Nearby Homes
- 116 Holcomb Hill Rd
- 537 Main St
- 7 Church St N
- 390 Main St
- 22 Wickett St
- 220 Main St Unit 6G
- 103 New Hartford Rd
- 57 Henderson Rd
- 45 Eddy Rd
- 22A Hoppen Rd
- 555 Town Hill Rd
- 22B Hoppen Rd
- 28 Fuller Rd
- 595 Town Hill Rd
- 18 Niles Rd
- 37 Maillet Ln
- 19 Ratlum Mountain Rd
- 13 Dew Rd
- 86 Bsullak Rd
- 15 Bunker Hill Rd