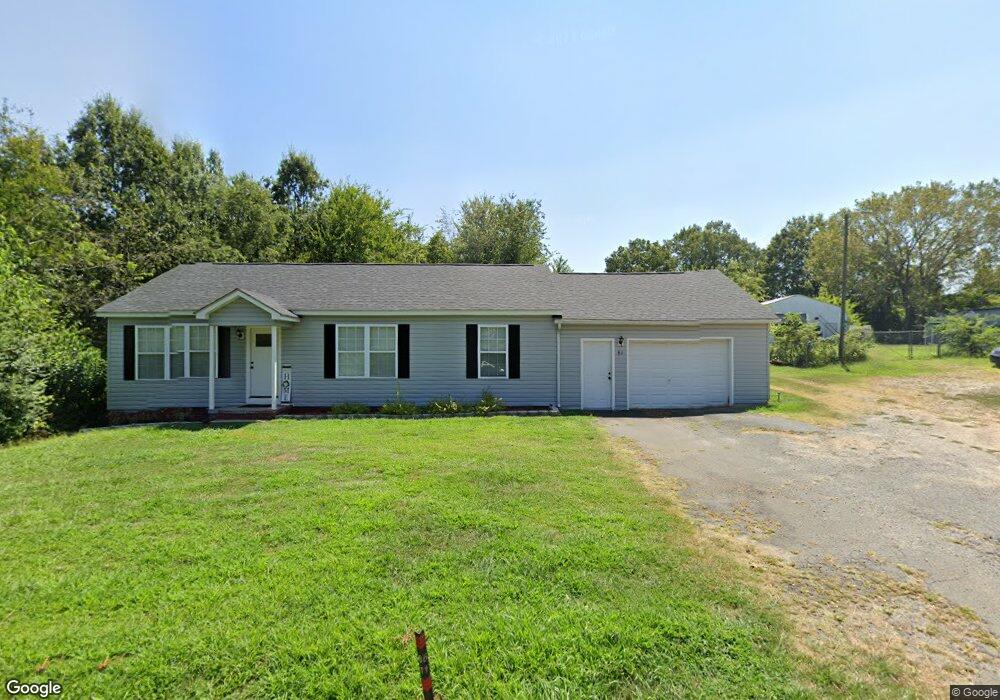
61 Roberta Rd SW Concord, NC 28027
Estimated Value: $204,000 - $235,000
3
Beds
1
Bath
1,080
Sq Ft
$204/Sq Ft
Est. Value
About This Home
This home is located at 61 Roberta Rd SW, Concord, NC 28027 and is currently estimated at $220,162, approximately $203 per square foot. 61 Roberta Rd SW is a home located in Cabarrus County with nearby schools including Wolf Meadow Elementary School, J.N. Fries Middle School, and Branch Christian Academy.
Ownership History
Date
Name
Owned For
Owner Type
Purchase Details
Closed on
Jan 14, 2021
Sold by
Hinson Ronnie Lynn and Hinson Regina F
Bought by
Legg Connor James and Noyola Iveth Balanzar
Current Estimated Value
Home Financials for this Owner
Home Financials are based on the most recent Mortgage that was taken out on this home.
Original Mortgage
$75,000
Outstanding Balance
$32,745
Interest Rate
2.71%
Mortgage Type
Purchase Money Mortgage
Estimated Equity
$187,417
Purchase Details
Closed on
Feb 10, 2005
Sold by
Wilson Randy Arlen and Wilson Renee Deese
Bought by
Wallace Johnny
Home Financials for this Owner
Home Financials are based on the most recent Mortgage that was taken out on this home.
Original Mortgage
$48,500
Interest Rate
5.72%
Mortgage Type
Purchase Money Mortgage
Purchase Details
Closed on
Sep 30, 2002
Sold by
Sides Beverly David and Sides Linda C
Bought by
Hinson Ronnie L and Hinson Regina L
Create a Home Valuation Report for This Property
The Home Valuation Report is an in-depth analysis detailing your home's value as well as a comparison with similar homes in the area
Home Values in the Area
Average Home Value in this Area
Purchase History
| Date | Buyer | Sale Price | Title Company |
|---|---|---|---|
| Legg Connor James | $75,000 | None Available | |
| Wallace Johnny | $54,000 | -- | |
| Hinson Ronnie L | $50,000 | -- |
Source: Public Records
Mortgage History
| Date | Status | Borrower | Loan Amount |
|---|---|---|---|
| Open | Legg Connor James | $75,000 | |
| Previous Owner | Wallace Johnny | $48,500 |
Source: Public Records
Tax History Compared to Growth
Tax History
| Year | Tax Paid | Tax Assessment Tax Assessment Total Assessment is a certain percentage of the fair market value that is determined by local assessors to be the total taxable value of land and additions on the property. | Land | Improvement |
|---|---|---|---|---|
| 2025 | $2,020 | $202,820 | $134,080 | $68,740 |
| 2024 | $2,020 | $202,820 | $134,080 | $68,740 |
| 2023 | $1,026 | $84,110 | $51,500 | $32,610 |
| 2022 | $1,026 | $84,110 | $51,500 | $32,610 |
| 2021 | $1,026 | $84,110 | $51,500 | $32,610 |
| 2020 | $1,026 | $84,110 | $51,500 | $32,610 |
| 2019 | $839 | $68,760 | $37,450 | $31,310 |
| 2018 | $825 | $68,760 | $37,450 | $31,310 |
| 2017 | $811 | $68,760 | $37,450 | $31,310 |
| 2016 | $481 | $67,040 | $32,770 | $34,270 |
| 2015 | -- | $67,040 | $32,770 | $34,270 |
| 2014 | -- | $67,040 | $32,770 | $34,270 |
Source: Public Records
Map
Nearby Homes
- 933 Old Charlotte Rd
- 207 Highland Ave SW
- 220 Highland Ave SW
- 82 Highland Ave SW
- 84 Highland Ave SW
- 1067 Old Charlotte Rd
- 41 Fleetwood Dr SW
- 782 Chalice St SW
- 664 Jackson Terrace SW
- 668 Jackson Terrace SW
- 809 Fargo Dr SW
- Lot #2 Faith Dr SW
- 758 Main St SW
- 1015 Rockland Cir SW
- 64 Robinson Dr SW
- 609 Faith Dr SW Unit 1
- 2893 Signal Ct SW
- 1255 Old Charlotte Rd
- 368 Office Dr SW
- 620 Palmer Ave SW
- 53 Roberta Rd SW
- 63 Roberta Rd SW
- 62 Roberta Rd SW
- 932 Old Charlotte Rd
- 928 Old Charlotte Rd Unit A
- 60 Roberta Rd SW
- 64 Roberta Rd SW
- 934 Old Charlotte Rd
- 938 Old Charlotte Rd
- 54 Roberta Rd SW
- 52 Roberta Rd SW
- 66 Roberta Rd SW
- 134 Alliance Ave SW
- 68 Roberta Rd SW
- 954 Old Charlotte Rd SW
- 931 Old Charlotte Rd
- 935 Old Charlotte Rd
- 923 Old Charlotte Rd
- 935 Old Charlotte Rd SW
- 921 Old Charlotte Rd