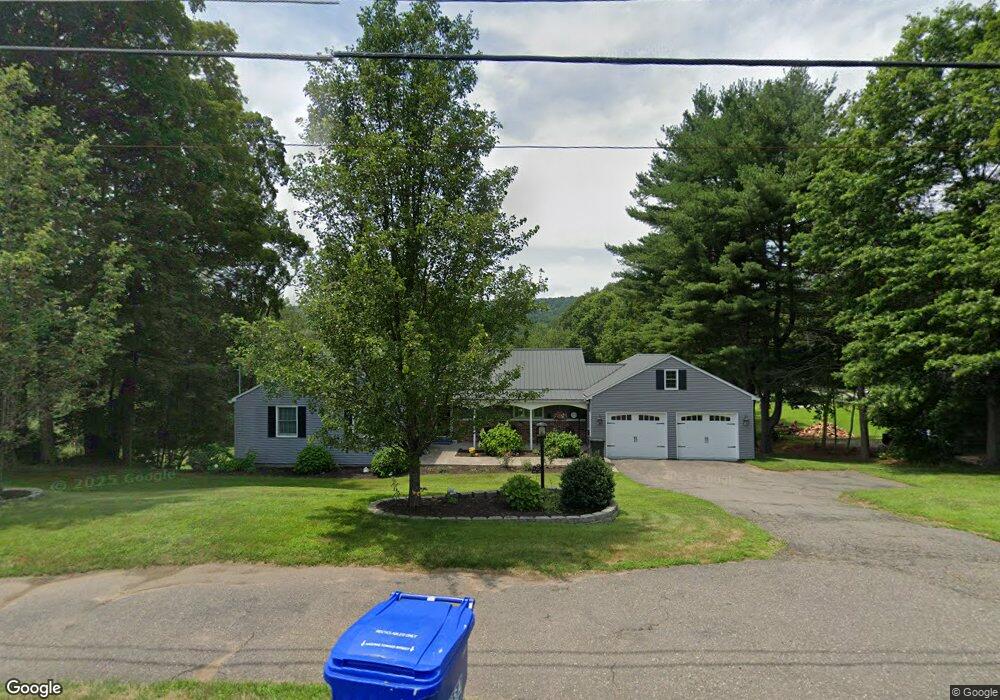
61 S Stone St West Suffield, CT 06093
Estimated Value: $430,000 - $520,000
4
Beds
3
Baths
1,732
Sq Ft
$279/Sq Ft
Est. Value
About This Home
This home is located at 61 S Stone St, West Suffield, CT 06093 and is currently estimated at $483,642, approximately $279 per square foot. 61 S Stone St is a home located in Hartford County with nearby schools including A. Ward Spaulding School, Mcalister Intermediate School, and Suffield Middle School.
Ownership History
Date
Name
Owned For
Owner Type
Purchase Details
Closed on
Dec 28, 2010
Sold by
Oneill John F and Oneill Clare A
Bought by
Trombly Michael and Morrison April
Current Estimated Value
Home Financials for this Owner
Home Financials are based on the most recent Mortgage that was taken out on this home.
Original Mortgage
$204,000
Outstanding Balance
$134,960
Interest Rate
4.17%
Estimated Equity
$348,682
Purchase Details
Closed on
Nov 23, 1993
Sold by
Corr Helen
Bought by
Oneill John and Oneill Clare
Home Financials for this Owner
Home Financials are based on the most recent Mortgage that was taken out on this home.
Original Mortgage
$154,600
Interest Rate
6.77%
Mortgage Type
Unknown
Purchase Details
Closed on
Aug 19, 1987
Sold by
Meleski Robert
Bought by
Corr Hugh
Home Financials for this Owner
Home Financials are based on the most recent Mortgage that was taken out on this home.
Original Mortgage
$100,000
Interest Rate
10.29%
Create a Home Valuation Report for This Property
The Home Valuation Report is an in-depth analysis detailing your home's value as well as a comparison with similar homes in the area
Home Values in the Area
Average Home Value in this Area
Purchase History
| Date | Buyer | Sale Price | Title Company |
|---|---|---|---|
| Trombly Michael | $255,000 | -- | |
| Oneill John | $204,600 | -- | |
| Corr Hugh | $228,050 | -- |
Source: Public Records
Mortgage History
| Date | Status | Borrower | Loan Amount |
|---|---|---|---|
| Open | Corr Hugh | $204,000 | |
| Previous Owner | Corr Hugh | $154,600 | |
| Previous Owner | Corr Hugh | $100,000 |
Source: Public Records
Tax History
| Year | Tax Paid | Tax Assessment Tax Assessment Total Assessment is a certain percentage of the fair market value that is determined by local assessors to be the total taxable value of land and additions on the property. | Land | Improvement |
|---|---|---|---|---|
| 2025 | $7,512 | $320,880 | $68,320 | $252,560 |
| 2024 | $7,262 | $320,880 | $68,320 | $252,560 |
| 2023 | $6,031 | $210,810 | $68,010 | $142,800 |
| 2022 | $6,031 | $210,810 | $68,010 | $142,800 |
| 2021 | $6,038 | $210,810 | $68,010 | $142,800 |
| 2020 | $6,038 | $210,810 | $68,010 | $142,800 |
| 2019 | $5,950 | $207,170 | $68,010 | $139,160 |
| 2018 | $5,902 | $201,300 | $65,360 | $135,940 |
| 2017 | $5,816 | $201,300 | $65,360 | $135,940 |
| 2016 | $5,677 | $201,300 | $65,360 | $135,940 |
| 2015 | $5,592 | $201,300 | $65,360 | $135,940 |
| 2014 | $5,459 | $201,300 | $65,360 | $135,940 |
Source: Public Records
Map
Nearby Homes
- 1054 Mountain Rd
- 200 N Main St
- 191 N Main St
- 02 S Grand St
- 01 S Grand St
- 1095 S Grand St
- 2 Stratton Farms Rd
- 187 Griffin Rd
- 10 Ridgewood Dr
- 245 Birch Rd
- 76 Newgate Rd
- 5 Maize Ln
- 18 Daniel Cir Unit 18
- 85 East St
- 1 E Elaine Dr
- 21 Newgate Rd
- 0 Suffield St Unit 24093452
- 0 Suffield St Unit 24057050
- 102 Petersen Rd
- 4066 Mountain Rd
Your Personal Tour Guide
Ask me questions while you tour the home.