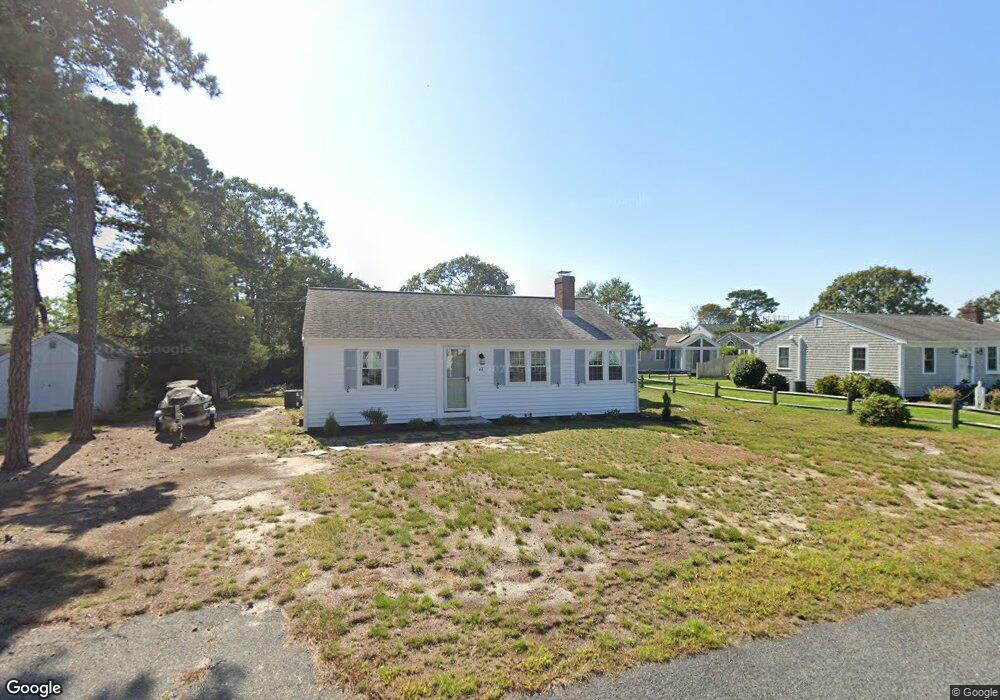
61 Santucket Rd West Dennis, MA 02670
West Dennis NeighborhoodEstimated Value: $656,000 - $882,000
2
Beds
1
Bath
856
Sq Ft
$871/Sq Ft
Est. Value
About This Home
This home is located at 61 Santucket Rd, West Dennis, MA 02670 and is currently estimated at $745,309, approximately $870 per square foot. 61 Santucket Rd is a home located in Barnstable County with nearby schools including Dennis-Yarmouth Regional High School and St. Pius X. School.
Ownership History
Date
Name
Owned For
Owner Type
Purchase Details
Closed on
Feb 12, 2025
Sold by
Richie Ann
Bought by
Sally R Harvell Lt and Harvell
Current Estimated Value
Purchase Details
Closed on
Apr 20, 2016
Sold by
Dias Nancy S Est and Simmons
Bought by
Sally R Harvell Lt and Richie
Purchase Details
Closed on
Jun 8, 2012
Sold by
Harvell Sally
Bought by
Sally R Harwell Lt and Harvell
Purchase Details
Closed on
Apr 4, 2011
Sold by
Jean G Roberts Nt and Harvell
Bought by
Harvell Sally and Richie Ann
Create a Home Valuation Report for This Property
The Home Valuation Report is an in-depth analysis detailing your home's value as well as a comparison with similar homes in the area
Home Values in the Area
Average Home Value in this Area
Purchase History
| Date | Buyer | Sale Price | Title Company |
|---|---|---|---|
| Sally R Harvell Lt | $291,000 | None Available | |
| Sally R Harvell Lt | $291,000 | None Available | |
| Sally R Harvell Lt | $152,000 | -- | |
| Sally R Harvell Lt | $152,000 | -- | |
| Simmons William B | -- | -- | |
| Simmons William B | -- | -- | |
| Sally R Harwell Lt | -- | -- | |
| Sally R Harwell Lt | -- | -- | |
| Harvell Sally | -- | -- | |
| Harvell Sally | -- | -- |
Source: Public Records
Tax History Compared to Growth
Tax History
| Year | Tax Paid | Tax Assessment Tax Assessment Total Assessment is a certain percentage of the fair market value that is determined by local assessors to be the total taxable value of land and additions on the property. | Land | Improvement |
|---|---|---|---|---|
| 2025 | $3,109 | $718,100 | $390,000 | $328,100 |
| 2024 | $2,643 | $602,000 | $312,500 | $289,500 |
| 2023 | $2,556 | $547,300 | $284,100 | $263,200 |
| 2022 | $2,510 | $448,300 | $255,900 | $192,400 |
| 2021 | $2,462 | $408,300 | $250,900 | $157,400 |
| 2020 | $3,284 | $421,800 | $278,800 | $143,000 |
| 2019 | $2,472 | $400,700 | $273,300 | $127,400 |
| 2018 | $2,074 | $327,100 | $234,200 | $92,900 |
| 2017 | $1,994 | $324,200 | $234,200 | $90,000 |
| 2016 | $2,060 | $315,500 | $239,400 | $76,100 |
| 2015 | $2,019 | $315,500 | $239,400 | $76,100 |
| 2014 | $1,871 | $294,700 | $218,600 | $76,100 |
Source: Public Records
Map
Nearby Homes
- 2 Rita Mary Way
- 14 Schoolhouse Ln
- 178 School St
- 209 Main St Unit 4
- 209 Main St Unit 3
- 209 Main St Unit 1
- 209 Main St Unit 6
- 209 Main St Unit 5
- 209 Main St Unit 2
- 23 Doric Ave
- 467 Main St
- 428 Main St Unit 1-11
- 45 Seth Ln
- 61 Trotters Ln
- 520 Main St Unit 5
- 116 N Main St
- 27 Mayflower Ln
- 31 Cherub Ln
- 23 Lakewood Rd
- 17 South St