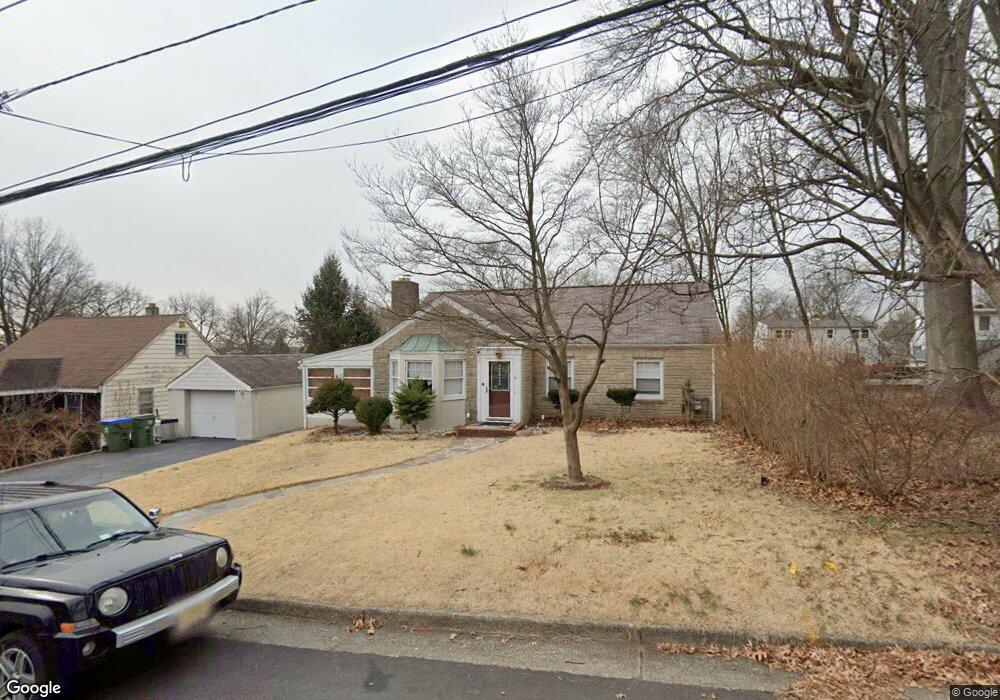
61 Seventh St Edison, NJ 08837
Estimated Value: $452,000 - $535,000
4
Beds
1
Bath
1,116
Sq Ft
$444/Sq Ft
Est. Value
About This Home
This home is located at 61 Seventh St, Edison, NJ 08837 and is currently estimated at $495,886, approximately $444 per square foot. 61 Seventh St is a home located in Middlesex County with nearby schools including James Monroe Elementary School, Herbert Hoover Middle School, and Edison High School.
Ownership History
Date
Name
Owned For
Owner Type
Purchase Details
Closed on
Jun 5, 2018
Sold by
Benavidez Tiffany and Benavidez Ruben
Bought by
Zeng Yangling and Xian Lianan
Current Estimated Value
Home Financials for this Owner
Home Financials are based on the most recent Mortgage that was taken out on this home.
Original Mortgage
$217,000
Outstanding Balance
$187,669
Interest Rate
4.5%
Mortgage Type
New Conventional
Estimated Equity
$308,217
Purchase Details
Closed on
Oct 24, 2014
Sold by
Estate Of Maureen H Gerrity
Bought by
Benavidez Tiffany
Home Financials for this Owner
Home Financials are based on the most recent Mortgage that was taken out on this home.
Original Mortgage
$242,250
Interest Rate
4.21%
Mortgage Type
New Conventional
Create a Home Valuation Report for This Property
The Home Valuation Report is an in-depth analysis detailing your home's value as well as a comparison with similar homes in the area
Home Values in the Area
Average Home Value in this Area
Purchase History
| Date | Buyer | Sale Price | Title Company |
|---|---|---|---|
| Zeng Yangling | $290,000 | First American Title Ins Co | |
| Benavidez Tiffany | $255,000 | Agent For Chicago Title Ins |
Source: Public Records
Mortgage History
| Date | Status | Borrower | Loan Amount |
|---|---|---|---|
| Open | Zeng Yangling | $217,000 | |
| Previous Owner | Benavidez Tiffany | $242,250 |
Source: Public Records
Tax History
| Year | Tax Paid | Tax Assessment Tax Assessment Total Assessment is a certain percentage of the fair market value that is determined by local assessors to be the total taxable value of land and additions on the property. | Land | Improvement |
|---|---|---|---|---|
| 2025 | $7,185 | $120,700 | $87,500 | $33,200 |
| 2024 | $7,147 | $120,700 | $87,500 | $33,200 |
| 2023 | $7,147 | $120,700 | $87,500 | $33,200 |
| 2022 | $7,149 | $120,700 | $87,500 | $33,200 |
| 2021 | $7,125 | $120,700 | $87,500 | $33,200 |
| 2020 | $7,060 | $120,700 | $87,500 | $33,200 |
| 2019 | $8,319 | $150,700 | $87,500 | $63,200 |
| 2018 | $8,173 | $150,700 | $87,500 | $63,200 |
| 2017 | $8,098 | $150,700 | $87,500 | $63,200 |
| 2016 | $7,951 | $150,700 | $87,500 | $63,200 |
| 2015 | $7,647 | $150,700 | $87,500 | $63,200 |
| 2014 | $7,423 | $150,700 | $87,500 | $63,200 |
Source: Public Records
Map
Nearby Homes
- 191 Hoover Ave
- 162 Brower Ave
- 212 Echo Ave
- 23 Carlton St
- 23 Carlton St S
- 51 Dartmouth St
- 71 Liddle Ave
- 99 Liddle Ave Unit B10
- 103 Liddle Ave
- 62 Harmon Rd
- 205 Liddle Ave
- 81 Liddle Ave
- 13A Garfield Park
- 12 Garfield Park Unit A
- 2 Garfield Park
- 39B Garfield Park Unit B
- 29B Garfield Park
- 1 Coolidge Ave
- 3181 Woodbridge Ave
- 21 Wilk Rd
Your Personal Tour Guide
Ask me questions while you tour the home.