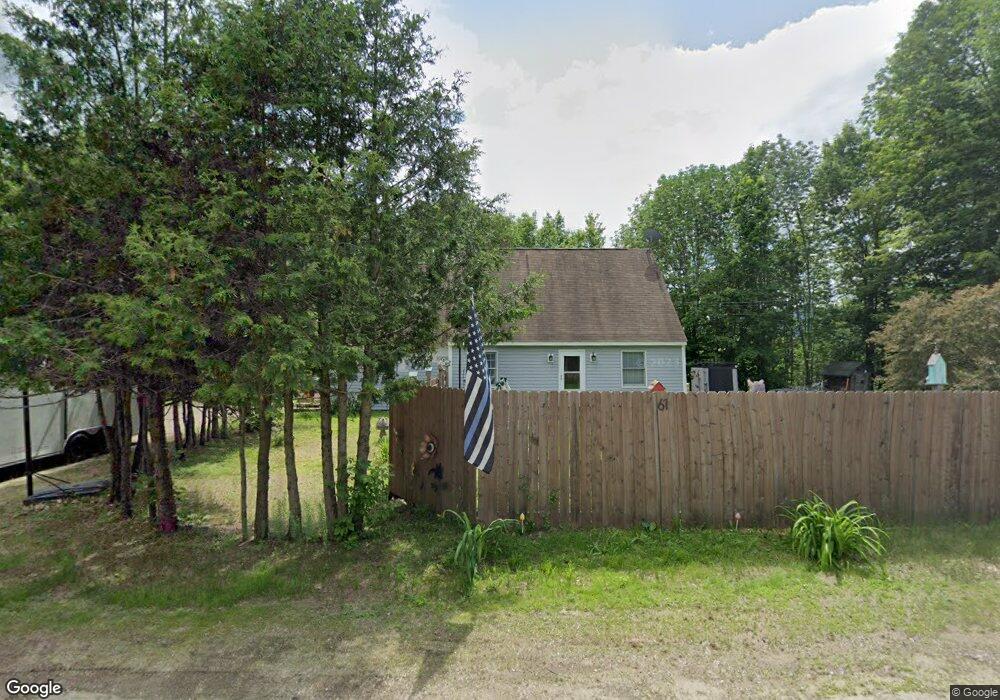
61 Spring St Dixfield, ME 04224
Estimated Value: $221,957 - $292,000
3
Beds
2
Baths
1,680
Sq Ft
$148/Sq Ft
Est. Value
About This Home
This home is located at 61 Spring St, Dixfield, ME 04224 and is currently estimated at $248,739, approximately $148 per square foot. 61 Spring St is a home located in Oxford County with nearby schools including Webb River seventh-day Adventist School.
Ownership History
Date
Name
Owned For
Owner Type
Purchase Details
Closed on
Mar 5, 2019
Sold by
Franklin Sb
Bought by
Woodhead Jon W and Woodhead Laurie L
Current Estimated Value
Home Financials for this Owner
Home Financials are based on the most recent Mortgage that was taken out on this home.
Original Mortgage
$65,860
Outstanding Balance
$57,552
Interest Rate
4.5%
Mortgage Type
New Conventional
Estimated Equity
$191,187
Purchase Details
Closed on
Nov 7, 2018
Sold by
Xanthos Laurie A and Franklin Savings Bank
Bought by
Franklin Savings Bank
Create a Home Valuation Report for This Property
The Home Valuation Report is an in-depth analysis detailing your home's value as well as a comparison with similar homes in the area
Purchase History
| Date | Buyer | Sale Price | Title Company |
|---|---|---|---|
| Woodhead Jon W | -- | -- | |
| Franklin Savings Bank | -- | -- |
Source: Public Records
Mortgage History
| Date | Status | Borrower | Loan Amount |
|---|---|---|---|
| Open | Woodhead Jon W | $65,860 |
Source: Public Records
Tax History
| Year | Tax Paid | Tax Assessment Tax Assessment Total Assessment is a certain percentage of the fair market value that is determined by local assessors to be the total taxable value of land and additions on the property. | Land | Improvement |
|---|---|---|---|---|
| 2025 | $2,379 | $97,700 | $20,800 | $76,900 |
| 2024 | $2,123 | $95,000 | $18,100 | $76,900 |
| 2023 | $2,043 | $95,000 | $18,100 | $76,900 |
| 2022 | $2,043 | $95,000 | $18,100 | $76,900 |
| 2021 | $2,280 | $95,000 | $18,100 | $76,900 |
| 2020 | $2,280 | $95,000 | $18,100 | $76,900 |
| 2019 | $2,561 | $95,000 | $18,100 | $76,900 |
| 2018 | $3,913 | $147,100 | $18,100 | $129,000 |
| 2017 | $3,648 | $163,600 | $24,000 | $139,600 |
| 2016 | $3,288 | $163,600 | $24,000 | $139,600 |
| 2015 | $3,337 | $163,600 | $24,000 | $139,600 |
| 2014 | $3,157 | $163,591 | $24,000 | $139,591 |
| 2013 | $3,182 | $163,591 | $24,000 | $139,591 |
Source: Public Records
Map
Nearby Homes
- Map 15 Lot 36a
- 26 Highland Ave
- 15 North St
- 40 Pine St
- 14 Nash St
- 34 Veterans St
- 13 Dix Ave
- 77 Red Ledge Rd
- 72 Main St
- 61 Webb River Dr
- 0 High St
- 158 Common Rd
- 80 Gammon Rd
- 303 Common Rd
- 052 Bradbury Ridge Rd Off Averill
- 181 Wyman Hill Rd
- 19 Knox Rd
- 168 Highland Terrace
- 51 Wyman Hill Rd
- 41 Wyman Hill Rd
Your Personal Tour Guide
Ask me questions while you tour the home.