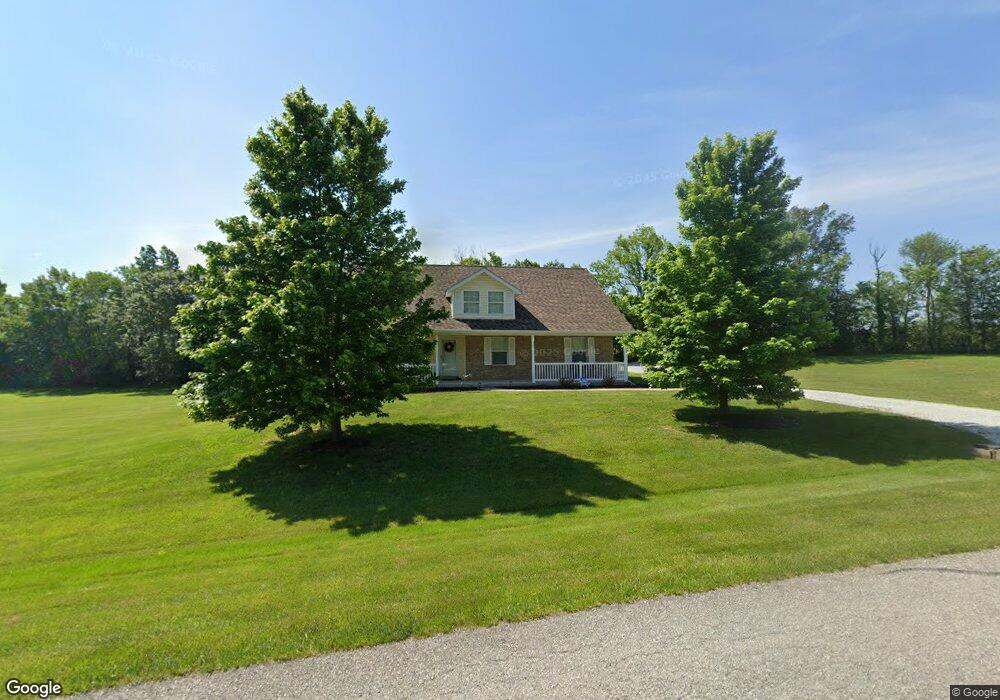
61 Summers Dr Hawk Point, MO 63349
Estimated Value: $416,000 - $444,000
3
Beds
2
Baths
1,822
Sq Ft
$233/Sq Ft
Est. Value
About This Home
This home is located at 61 Summers Dr, Hawk Point, MO 63349 and is currently estimated at $425,237, approximately $233 per square foot. 61 Summers Dr is a home located in Lincoln County with nearby schools including Hawk Point Elementary School, Troy Middle School, and Troy Buchanan High School.
Ownership History
Date
Name
Owned For
Owner Type
Purchase Details
Closed on
Jul 28, 2015
Sold by
Whiteley Charles V
Bought by
Ellis Carol L and The Carol L Ellis Revocable Trust
Current Estimated Value
Purchase Details
Closed on
Jan 31, 2007
Sold by
Tst Inc
Bought by
Whiteley Charles
Home Financials for this Owner
Home Financials are based on the most recent Mortgage that was taken out on this home.
Original Mortgage
$30,750
Interest Rate
6.19%
Mortgage Type
New Conventional
Purchase Details
Closed on
Jul 7, 2006
Sold by
Henke Charles R and Henke Heather A
Bought by
Tst Inc
Purchase Details
Closed on
Jun 10, 2005
Sold by
Tst Inc
Bought by
Henke Charles R and Henke Heather A
Home Financials for this Owner
Home Financials are based on the most recent Mortgage that was taken out on this home.
Original Mortgage
$35,805
Interest Rate
5.79%
Mortgage Type
Stand Alone Second
Create a Home Valuation Report for This Property
The Home Valuation Report is an in-depth analysis detailing your home's value as well as a comparison with similar homes in the area
Purchase History
| Date | Buyer | Sale Price | Title Company |
|---|---|---|---|
| Ellis Carol L | -- | Ust | |
| Whiteley Charles | -- | Meyer Title Co | |
| Tst Inc | -- | Meyer Title Comapnuy | |
| Henke Charles R | -- | Meyer Title Company |
Source: Public Records
Mortgage History
| Date | Status | Borrower | Loan Amount |
|---|---|---|---|
| Previous Owner | Whiteley Charles | $30,750 | |
| Previous Owner | Henke Charles R | $35,805 |
Source: Public Records
Tax History
| Year | Tax Paid | Tax Assessment Tax Assessment Total Assessment is a certain percentage of the fair market value that is determined by local assessors to be the total taxable value of land and additions on the property. | Land | Improvement |
|---|---|---|---|---|
| 2025 | $2,767 | $47,989 | $6,090 | $41,899 |
| 2024 | $2,706 | $43,850 | $5,185 | $38,665 |
| 2023 | $2,692 | $43,850 | $5,185 | $38,665 |
| 2022 | $2,555 | $41,922 | $5,185 | $36,737 |
| 2021 | $2,569 | $220,640 | $0 | $0 |
| 2020 | $2,220 | $194,000 | $0 | $0 |
| 2019 | $2,222 | $194,000 | $0 | $0 |
| 2018 | $2,272 | $37,192 | $0 | $0 |
| 2017 | $2,279 | $37,192 | $0 | $0 |
| 2016 | $1,978 | $31,634 | $0 | $0 |
| 2015 | $1,977 | $31,634 | $0 | $0 |
| 2014 | -- | $31,782 | $0 | $0 |
| 2013 | -- | $31,782 | $0 | $0 |
Source: Public Records
Map
Nearby Homes
- 8 Summers Breeze Ct
- 2 Country Ridge Trail
- 20 Chinkapin Ct
- 300 Shumard Oak Dr
- 415 Walnut St
- 4 Ashley Ln
- 339 White Rd
- 140 Turkey Creek Crossing Dr
- 62 Copper Hills Cove
- 456 Westridge Dr
- 459 Westridge Dr
- 157 Denise Ct
- 0 Westridge Dr
- 408 Westridge Dr
- 310 Red Wing Ct
- 244 S Moore School Rd
- 30 Deer Valley Ct
- 762 Cave Farm Rd
- 346 Bethel Rd
- 65 Oak Valley Dr
- 51 Summers Dr
- 60 Summers Dr
- 81 Summers Dr
- 3 Summers Breeze Ct
- 80 Summers Dr
- 80TBB Summers Dr
- 115 Butterfly Ridge
- 31 Summers Dr
- 160 Summers Dr
- 5 Summers Breeze Ct
- 91 Summers Dr
- 11 Summers Dr
- 170 Summers Dr
- 30 Summers Dr
- 4 Summers Breeze Ct
- 150 Summers Dr
- 10 Summers Dr
- 5 Country Ridge Trail
- 101 Summers Dr
- 6 Country Ridge Trail
Your Personal Tour Guide
Ask me questions while you tour the home.