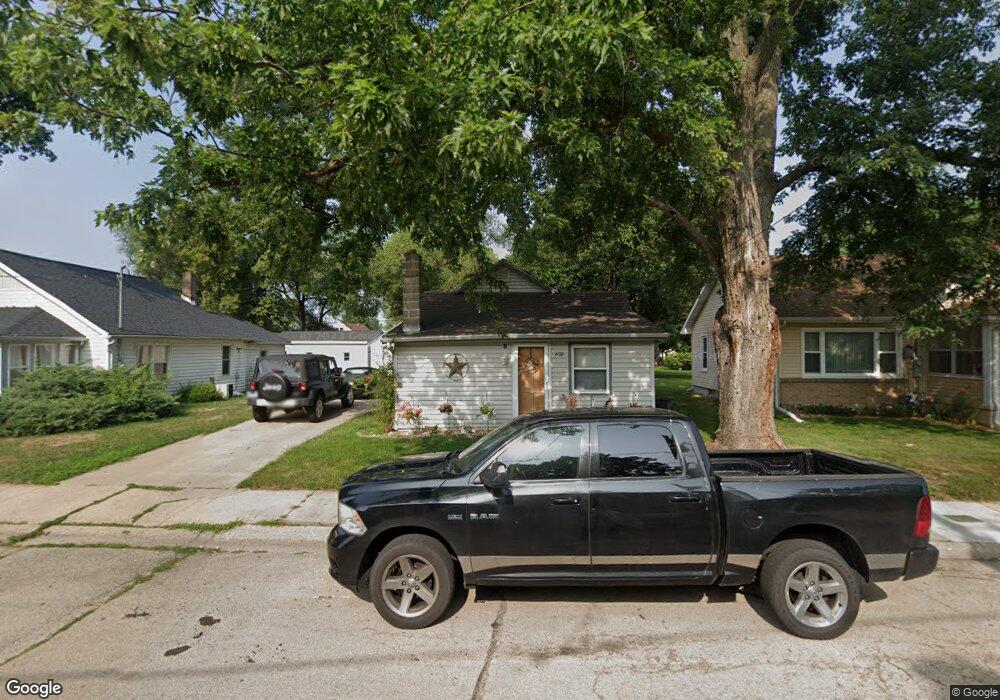
610 11th Ave Rock Falls, IL 61071
Estimated Value: $97,442 - $140,000
3
Beds
1
Bath
1,535
Sq Ft
$78/Sq Ft
Est. Value
About This Home
This home is located at 610 11th Ave, Rock Falls, IL 61071 and is currently estimated at $119,861, approximately $78 per square foot. 610 11th Ave is a home located in Whiteside County with nearby schools including Merrill Elementary School, Dillon Elementary School, and Rock Falls Middle School.
Ownership History
Date
Name
Owned For
Owner Type
Purchase Details
Closed on
Apr 1, 2016
Sold by
Patch Dawn M and Ege Dawn M
Bought by
Ege Daniel J
Current Estimated Value
Purchase Details
Closed on
Nov 30, 2007
Sold by
Aufiero John M
Bought by
Ege Daniel J and Ege Dawn M
Home Financials for this Owner
Home Financials are based on the most recent Mortgage that was taken out on this home.
Original Mortgage
$78,665
Interest Rate
6.33%
Mortgage Type
FHA
Purchase Details
Closed on
Mar 17, 2007
Sold by
Fannie Mae
Bought by
Aufiero John M
Purchase Details
Closed on
Oct 16, 2006
Sold by
Frump Thomas and Frump Trisha
Bought by
Federal National Mortgage Association
Create a Home Valuation Report for This Property
The Home Valuation Report is an in-depth analysis detailing your home's value as well as a comparison with similar homes in the area
Home Values in the Area
Average Home Value in this Area
Purchase History
| Date | Buyer | Sale Price | Title Company |
|---|---|---|---|
| Ege Daniel J | -- | Attorney | |
| Ege Daniel J | $80,000 | None Available | |
| Aufiero John M | -- | None Available | |
| Federal National Mortgage Association | -- | None Available |
Source: Public Records
Mortgage History
| Date | Status | Borrower | Loan Amount |
|---|---|---|---|
| Closed | Ege Daniel J | $78,665 |
Source: Public Records
Tax History Compared to Growth
Tax History
| Year | Tax Paid | Tax Assessment Tax Assessment Total Assessment is a certain percentage of the fair market value that is determined by local assessors to be the total taxable value of land and additions on the property. | Land | Improvement |
|---|---|---|---|---|
| 2024 | $2,589 | $29,602 | $3,996 | $25,606 |
| 2023 | $2,389 | $27,300 | $3,685 | $23,615 |
| 2022 | $2,248 | $25,440 | $3,474 | $21,966 |
| 2021 | $2,124 | $24,068 | $3,287 | $20,781 |
| 2020 | $2,114 | $23,657 | $3,231 | $20,426 |
| 2019 | $1,977 | $22,810 | $3,115 | $19,695 |
| 2018 | $1,834 | $22,302 | $3,046 | $19,256 |
| 2017 | $1,820 | $21,884 | $2,989 | $18,895 |
| 2016 | $1,775 | $21,516 | $2,939 | $18,577 |
| 2015 | $1,679 | $21,623 | $3,087 | $18,536 |
| 2014 | $1,655 | $21,046 | $3,005 | $18,041 |
| 2013 | $1,679 | $21,623 | $3,087 | $18,536 |
Source: Public Records
Map
Nearby Homes