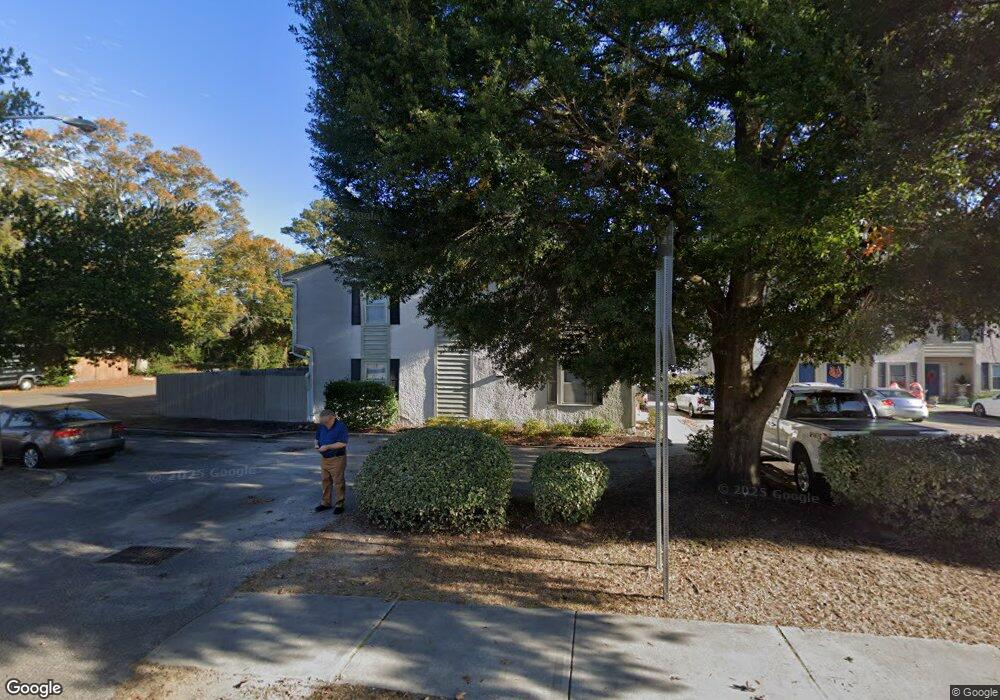
610 67th Ave N Unit B Myrtle Beach, SC 29572
Grande Dunes NeighborhoodEstimated Value: $181,000 - $224,593
2
Beds
2
Baths
1,232
Sq Ft
$162/Sq Ft
Est. Value
About This Home
This home is located at 610 67th Ave N Unit B, Myrtle Beach, SC 29572 and is currently estimated at $199,398, approximately $161 per square foot. 610 67th Ave N Unit B is a home located in Horry County with nearby schools including Myrtle Beach Child Development Center, Myrtle Beach Elementary School, and Myrtle Beach Primary School.
Ownership History
Date
Name
Owned For
Owner Type
Purchase Details
Closed on
Oct 20, 2015
Bought by
Richardson J Ho
Current Estimated Value
Purchase Details
Closed on
Oct 30, 2012
Sold by
Mccollum M Gregory
Bought by
Richardson Hazel S
Purchase Details
Closed on
May 4, 2006
Sold by
Gutheil Suzann Burns French
Bought by
Mccollum M Gregory and Ely Mccollum Sarah June
Purchase Details
Closed on
Sep 19, 2005
Sold by
Gutheil Suzann Burns French
Bought by
Burns Gutheil Suzann Burns French and Burns French Suzann
Purchase Details
Closed on
Oct 27, 1999
Sold by
Kathy Lawless Donna and Lawless Kathy Lawless
Bought by
French Susan Lynne
Home Financials for this Owner
Home Financials are based on the most recent Mortgage that was taken out on this home.
Original Mortgage
$71,000
Interest Rate
7.7%
Mortgage Type
Unknown
Create a Home Valuation Report for This Property
The Home Valuation Report is an in-depth analysis detailing your home's value as well as a comparison with similar homes in the area
Home Values in the Area
Average Home Value in this Area
Purchase History
| Date | Buyer | Sale Price | Title Company |
|---|---|---|---|
| Richardson J Ho | -- | -- | |
| Richardson Hazel S | $62,000 | -- | |
| Mccollum M Gregory | $118,000 | None Available | |
| Burns Gutheil Suzann Burns French | -- | -- | |
| French Susan Lynne | $73,200 | -- |
Source: Public Records
Mortgage History
| Date | Status | Borrower | Loan Amount |
|---|---|---|---|
| Previous Owner | French Susan Lynne | $71,000 |
Source: Public Records
Tax History Compared to Growth
Tax History
| Year | Tax Paid | Tax Assessment Tax Assessment Total Assessment is a certain percentage of the fair market value that is determined by local assessors to be the total taxable value of land and additions on the property. | Land | Improvement |
|---|---|---|---|---|
| 2024 | $1,416 | $11,436 | $6,000 | $5,436 |
| 2023 | $1,416 | $4,837 | $900 | $3,937 |
| 2021 | $1,308 | $9,209 | $1,575 | $7,634 |
| 2020 | $1,247 | $9,209 | $1,575 | $7,634 |
| 2019 | $1,247 | $9,209 | $1,575 | $7,634 |
| 2018 | $0 | $7,361 | $1,470 | $5,891 |
| 2017 | $1,107 | $4,206 | $840 | $3,366 |
| 2016 | -- | $4,206 | $840 | $3,366 |
| 2015 | $1,095 | $2,804 | $560 | $2,244 |
| 2014 | $1,064 | $2,804 | $560 | $2,244 |
Source: Public Records
Map
Nearby Homes
- 6706 Bryant St Unit C
- TBD 67th Ave N
- TBD Bryant St. Bryant St Unit BRYANT DR; PARCEL 2-
- 6708 Bryant St Unit E
- 6703 Bryant St Unit A
- 6703 Bryant St
- 6624 Lagoon Place
- 6702 Jefferson Place Unit F2
- 6702 Jefferson Place Unit C3
- 6702 Jefferson Place Unit B6
- 6702 Jefferson Place Unit C6
- 712 67th Ave N Unit 2A
- 712 67th Ave N Unit 1E
- 6703 Jefferson Place Unit B1
- 6703 Jefferson Place Unit B-2
- 600 65th Ave N Unit 7
- 6619 Colonial Dr
- 6510 Wildwood Trail Unit 8
- 6306 Somerset Dr
- 843 67th Ave N
- 610 67th Ave N Unit B2 Northlake Townhom
- 610 67th Ave N Unit A3
- 610 67th Ave N
- 610 67th Ave N
- 610 67th Ave N Unit C5
- 610 67th Ave N Unit C3
- 610 67th Ave N Unit B5
- 610 67th Ave N Unit B4
- 610 67th Ave N Unit B1
- 610 67th Ave N
- 610 67th Ave N Unit A6
- 610 67th Ave N Unit A5
- 610 67th Ave N Unit B3
- 610 67th Ave N Unit B2
- 701 67th Ave N
- 6704C Bryant St Unit C
- 6704 Bryant St
- 6704 Bryant St Unit E
- 6704 Bryant St Unit D
- 6704B Bryant St Unit B