Estimated Value: $444,000 - $769,000
4
Beds
4
Baths
3,476
Sq Ft
$165/Sq Ft
Est. Value
About This Home
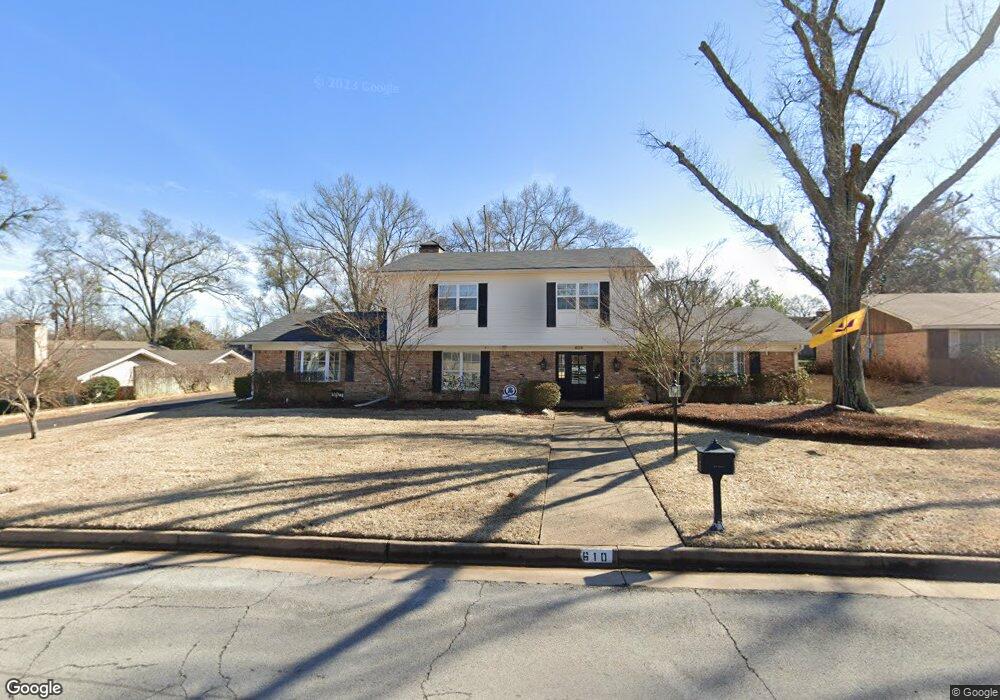
This home is located at 610 Barclay Dr, Tyler, TX 75703 and is currently estimated at $572,817, approximately $164 per square foot. 610 Barclay Dr is a home located in Smith County with nearby schools including Rice Elementary School, Hubbard Middle School, and Tyler Legacy High School.
Ownership History
Date
Name
Owned For
Owner Type
Purchase Details
Closed on
Mar 15, 2022
Sold by
Dale Harry Gregory and Hale Aubrey
Bought by
Allegiance Government Relo
Current Estimated Value
Purchase Details
Closed on
Apr 25, 2016
Sold by
Gillen E Drew and Gillen Lindsay Deaton
Bought by
Harry Gregory Dale and Harry Aubrey Hale
Home Financials for this Owner
Home Financials are based on the most recent Mortgage that was taken out on this home.
Original Mortgage
$315,000
Interest Rate
3.73%
Mortgage Type
New Conventional
Purchase Details
Closed on
May 24, 2011
Sold by
Deaton Thomas W and Deaton Jan B
Bought by
Gillen Drew and Gillen Lindsay
Purchase Details
Closed on
May 15, 2008
Sold by
Grubb Gregory P and Grubb Dana H
Bought by
Gillen E Drew and Gillen Lindsay Deaton
Home Financials for this Owner
Home Financials are based on the most recent Mortgage that was taken out on this home.
Original Mortgage
$172,000
Interest Rate
5.89%
Mortgage Type
Purchase Money Mortgage
Create a Home Valuation Report for This Property
The Home Valuation Report is an in-depth analysis detailing your home's value as well as a comparison with similar homes in the area
Home Values in the Area
Average Home Value in this Area
Purchase History
| Date | Buyer | Sale Price | Title Company |
|---|---|---|---|
| Allegiance Government Relo | -- | None Listed On Document | |
| Harry Gregory Dale | -- | None Available | |
| Gillen Drew | -- | None Available | |
| Gillen E Drew | -- | Smith County Title Company |
Source: Public Records
Mortgage History
| Date | Status | Borrower | Loan Amount |
|---|---|---|---|
| Previous Owner | Harry Gregory Dale | $315,000 | |
| Previous Owner | Gillen E Drew | $172,000 | |
| Closed | Gillen Drew | $0 |
Source: Public Records
Tax History Compared to Growth
Tax History
| Year | Tax Paid | Tax Assessment Tax Assessment Total Assessment is a certain percentage of the fair market value that is determined by local assessors to be the total taxable value of land and additions on the property. | Land | Improvement |
|---|---|---|---|---|
| 2025 | $5,809 | $363,942 | $62,802 | $301,140 |
| 2024 | $5,809 | $400,605 | $57,232 | $343,373 |
| 2023 | $9,252 | $530,762 | $57,232 | $473,530 |
| 2022 | $6,566 | $368,267 | $52,582 | $315,685 |
| 2021 | $6,520 | $332,215 | $52,582 | $279,633 |
| 2020 | $5,910 | $300,951 | $52,582 | $248,369 |
| 2019 | $6,033 | $301,216 | $35,770 | $265,446 |
| 2018 | $6,067 | $296,815 | $35,770 | $261,045 |
| 2017 | $6,033 | $296,815 | $35,770 | $261,045 |
| 2016 | $4,182 | $214,285 | $35,770 | $178,515 |
| 2015 | $4,283 | $217,306 | $35,770 | $181,536 |
| 2014 | $4,283 | $213,487 | $35,770 | $177,717 |
Source: Public Records
Map
Nearby Homes
- 429 Holiday Ln
- 418 Boyd Ln
- 7434 Waterview Square
- 6052 N Park Central Ct
- 410 Brighton Ct
- 604-606 Woodland Hills Dr
- 504 Woodland Hills Dr
- 5106 Cloverdale Dr
- 701 Woodland Hills Dr
- 704 Paloma St
- 612 Rosemont Place II
- 3617 Jill Cir
- 815 Woodland Hills Dr
- 601 Carriage Dr
- 3829 Cloverdale Dr
- 4001 Darrell Ln
- 3915 Post Oak Rd
- 3606 Glendale Dr
- 842 Carriage Dr
- 11948 Gillian Ct
- 610 610 Barclay
- 616 Barclay Dr
- 600 Barclay Dr
- 609 Dorchester Dr
- 4511 Richmond Rd
- 609 Barclay Dr
- 615 615 Dorchester
- 615 Dorchester Dr
- 615 Barclay Dr
- 622 Barclay Dr
- 4411 Richmond Rd
- 621 Barclay Dr
- 621 Dorchester Dr
- 610 610 Trenton
- 610 Trenton Dr
- 4510 Richmond Rd
- 616 616 Trenton Dr
- 616 Trenton Dr
- 4401 Richmond Rd
- 600 600 Dorchester