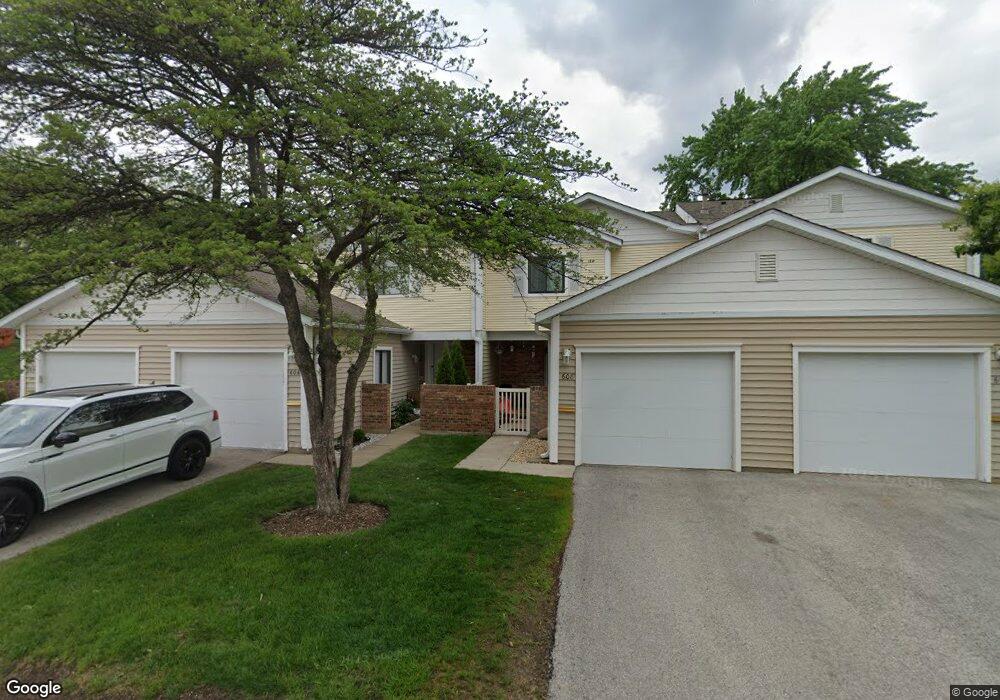
610 Bayview Point Unit 42D Schaumburg, IL 60194
East Schaumburg NeighborhoodEstimated Value: $273,039 - $332,000
2
Beds
--
Bath
1,440
Sq Ft
$211/Sq Ft
Est. Value
About This Home
This home is located at 610 Bayview Point Unit 42D, Schaumburg, IL 60194 and is currently estimated at $303,510, approximately $210 per square foot. 610 Bayview Point Unit 42D is a home located in Cook County with nearby schools including Everett Dirksen Elementary School, Robert Frost Junior High School, and J B Conant High School.
Ownership History
Date
Name
Owned For
Owner Type
Purchase Details
Closed on
Apr 28, 2000
Sold by
Patel Gautam U and Patel Mrudula G
Bought by
Parekh Hareshkumar J and Parekh Daksha H
Current Estimated Value
Home Financials for this Owner
Home Financials are based on the most recent Mortgage that was taken out on this home.
Original Mortgage
$112,000
Outstanding Balance
$37,939
Interest Rate
7.87%
Estimated Equity
$265,571
Purchase Details
Closed on
Mar 31, 1997
Sold by
Olsen Karen S and Mueller Jill E
Bought by
Patel Mrudula G and Patel Gautam U
Home Financials for this Owner
Home Financials are based on the most recent Mortgage that was taken out on this home.
Original Mortgage
$90,000
Interest Rate
7.93%
Purchase Details
Closed on
Jan 15, 1996
Sold by
Olsen Karen S
Bought by
Olsen Karen S and Mueller Jill E
Create a Home Valuation Report for This Property
The Home Valuation Report is an in-depth analysis detailing your home's value as well as a comparison with similar homes in the area
Home Values in the Area
Average Home Value in this Area
Purchase History
| Date | Buyer | Sale Price | Title Company |
|---|---|---|---|
| Parekh Hareshkumar J | $140,000 | -- | |
| Patel Mrudula G | -- | Attorneys Natl Title Network | |
| Olsen Karen S | -- | -- |
Source: Public Records
Mortgage History
| Date | Status | Borrower | Loan Amount |
|---|---|---|---|
| Open | Parekh Hareshkumar J | $112,000 | |
| Previous Owner | Patel Mrudula G | $90,000 |
Source: Public Records
Tax History Compared to Growth
Tax History
| Year | Tax Paid | Tax Assessment Tax Assessment Total Assessment is a certain percentage of the fair market value that is determined by local assessors to be the total taxable value of land and additions on the property. | Land | Improvement |
|---|---|---|---|---|
| 2024 | $3,691 | $19,144 | $4,091 | $15,053 |
| 2023 | $3,528 | $19,144 | $4,091 | $15,053 |
| 2022 | $3,528 | $19,144 | $4,091 | $15,053 |
| 2021 | $3,227 | $16,642 | $5,241 | $11,401 |
| 2020 | $3,294 | $16,642 | $5,241 | $11,401 |
| 2019 | $3,304 | $18,501 | $5,241 | $13,260 |
| 2018 | $3,623 | $15,508 | $4,410 | $11,098 |
| 2017 | $3,584 | $15,508 | $4,410 | $11,098 |
| 2016 | $3,594 | $15,508 | $4,410 | $11,098 |
| 2015 | $2,681 | $11,586 | $3,835 | $7,751 |
| 2014 | $2,668 | $11,586 | $3,835 | $7,751 |
| 2013 | $3,108 | $12,505 | $3,835 | $8,670 |
Source: Public Records
Map
Nearby Homes
- 325 Bayview Point Unit 56B
- 751 Edgelake Point Unit 68C
- 601 Hanover Ct Unit Z2
- 602 Eastview Ct Unit Z1
- 600 Eastview Ct Unit X1
- 802 Stonewall Ct Unit 55
- 465 Apache Ln
- 121 Chatsworth Cir
- 22 Ascot Cir
- 28 Ascot Cir
- 705 Ash Rd
- 85 Marble Hill Ct Unit A1
- 350 Newgate Ct Unit 2Z
- 845 Dracut Ln
- 147 Fulbright Ln
- 91 Lambert Dr Unit B1
- 153 Fulbright Ln
- 287 Pembridge Ln Unit B2
- 700 Cumberland St
- 15 Bar Harbour Rd Unit 4F
- 608 Bayview Point Unit 42C
- 612 Bayview Point Unit 43F
- 614 Bayview Point Unit 43B
- 606 Bayview Point Unit 41D
- 616 Bayview Point Unit 44C
- 618 Bayview Point Unit 44A
- 335 Clearwater Ln Unit 51D
- 333 Clearwater Ln Unit 51C
- 329 Clearwater Ln Unit 51A
- 622 Bayview Point Unit 45D
- 331 Clearwater Ln Unit 51B
- 331 Clearwater Ln Unit 331
- 336 Clearwater Ln Unit 40C
- 615 Bayview Point Unit 49B
- 334 Clearwater Ln Unit 40B
- 617 Bayview Point Unit 50A
- 624 Bayview Point Unit 46C
- 624 Bayview Point Unit 624
- 332 Clearwater Ln Unit 39A
- 326 Clearwater Ln Unit 38F