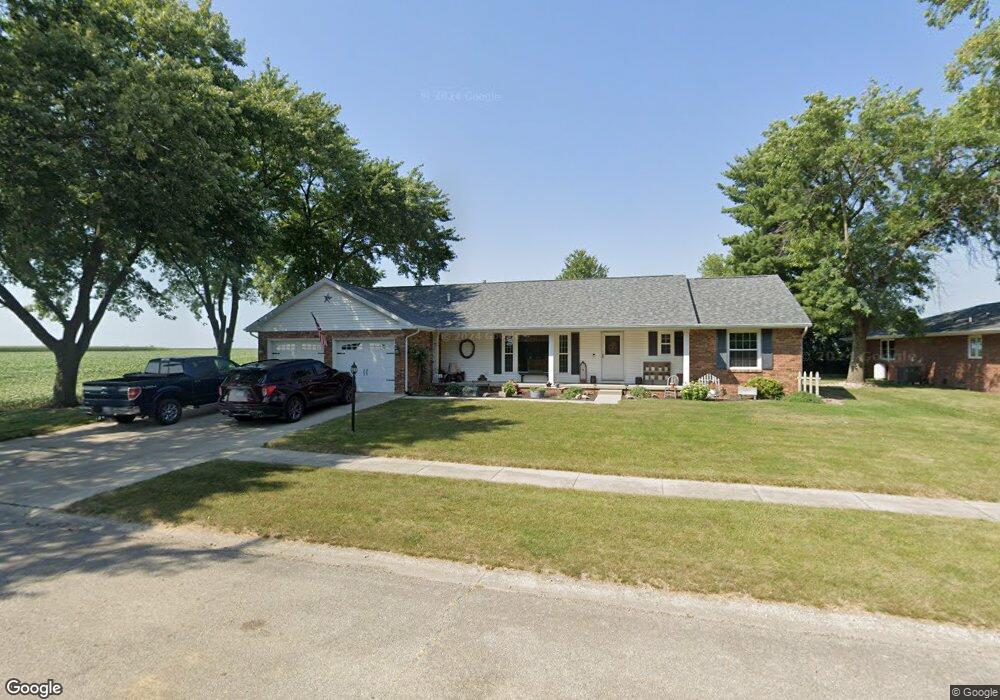
610 Bonn St Arthur, IL 61911
Estimated Value: $190,725 - $228,000
3
Beds
2
Baths
1,582
Sq Ft
$128/Sq Ft
Est. Value
About This Home
This home is located at 610 Bonn St, Arthur, IL 61911 and is currently estimated at $201,931, approximately $127 per square foot. 610 Bonn St is a home located in Moultrie County with nearby schools including Arthur Grade School, Arthur Lovington Atwood Hammond High School, and Northside School.
Ownership History
Date
Name
Owned For
Owner Type
Purchase Details
Closed on
Apr 21, 2022
Sold by
Lewis Gayle L and Fornshell Gayle L
Bought by
Fornshell Lester William and Fornshell Gayle L
Current Estimated Value
Home Financials for this Owner
Home Financials are based on the most recent Mortgage that was taken out on this home.
Original Mortgage
$80,000
Outstanding Balance
$65,632
Interest Rate
3.88%
Mortgage Type
New Conventional
Estimated Equity
$136,299
Purchase Details
Closed on
Jul 22, 2008
Sold by
Lewis David W
Bought by
Lewis Gayle L
Create a Home Valuation Report for This Property
The Home Valuation Report is an in-depth analysis detailing your home's value as well as a comparison with similar homes in the area
Home Values in the Area
Average Home Value in this Area
Purchase History
| Date | Buyer | Sale Price | Title Company |
|---|---|---|---|
| Fornshell Lester William | -- | None Listed On Document | |
| Lewis Gayle L | -- | None Available |
Source: Public Records
Mortgage History
| Date | Status | Borrower | Loan Amount |
|---|---|---|---|
| Open | Fornshell Lester William | $80,000 |
Source: Public Records
Tax History Compared to Growth
Tax History
| Year | Tax Paid | Tax Assessment Tax Assessment Total Assessment is a certain percentage of the fair market value that is determined by local assessors to be the total taxable value of land and additions on the property. | Land | Improvement |
|---|---|---|---|---|
| 2024 | $3,390 | $56,814 | $3,052 | $53,762 |
| 2023 | $3,301 | $53,341 | $2,865 | $50,476 |
| 2022 | $3,724 | $56,769 | $5,133 | $51,636 |
| 2021 | $3,651 | $53,973 | $4,880 | $49,093 |
| 2020 | $3,585 | $51,827 | $4,686 | $47,141 |
| 2019 | $3,502 | $50,916 | $4,604 | $46,312 |
| 2018 | $3,533 | $51,500 | $3,219 | $48,281 |
| 2017 | $3,538 | $51,300 | $3,206 | $48,094 |
| 2016 | $3,668 | $51,413 | $3,213 | $48,200 |
| 2015 | $3,564 | $50,410 | $3,150 | $47,260 |
| 2014 | -- | $50,445 | $3,477 | $46,968 |
| 2013 | -- | $50,445 | $3,477 | $46,968 |
Source: Public Records
Map
Nearby Homes