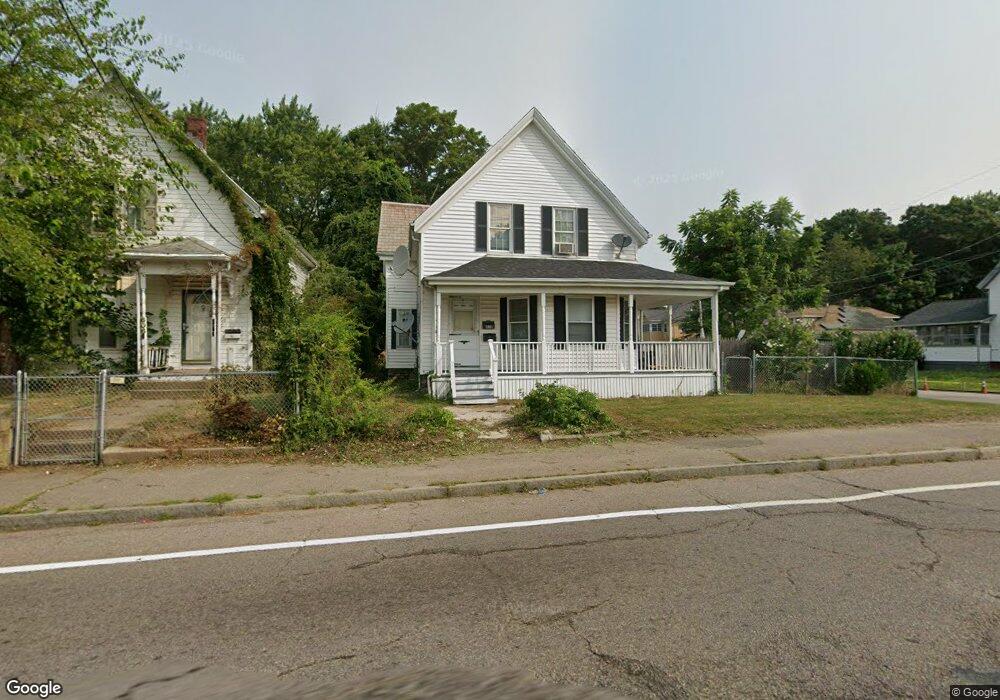
610 Centre St Brockton, MA 02302
Estimated Value: $450,000 - $491,000
4
Beds
3
Baths
1,592
Sq Ft
$292/Sq Ft
Est. Value
About This Home
This home is located at 610 Centre St, Brockton, MA 02302 and is currently estimated at $464,126, approximately $291 per square foot. 610 Centre St is a home located in Plymouth County with nearby schools including Brookfield Elementary School, Downey Elementary School, and Mary E. Baker Elementary School.
Ownership History
Date
Name
Owned For
Owner Type
Purchase Details
Closed on
Nov 20, 2003
Sold by
Zhang Jiao Hua
Bought by
Enamorado Carlos R
Current Estimated Value
Home Financials for this Owner
Home Financials are based on the most recent Mortgage that was taken out on this home.
Original Mortgage
$167,900
Outstanding Balance
$77,731
Interest Rate
5.98%
Mortgage Type
Purchase Money Mortgage
Estimated Equity
$386,395
Purchase Details
Closed on
Jul 19, 2000
Sold by
Silva John Louis
Bought by
Zhang Jiao Hua
Purchase Details
Closed on
Apr 25, 1997
Sold by
Tourinho Walter G and Tourinho Dolores
Bought by
Silva John L
Create a Home Valuation Report for This Property
The Home Valuation Report is an in-depth analysis detailing your home's value as well as a comparison with similar homes in the area
Purchase History
| Date | Buyer | Sale Price | Title Company |
|---|---|---|---|
| Enamorado Carlos R | $209,900 | -- | |
| Zhang Jiao Hua | $130,000 | -- | |
| Silva John L | $79,000 | -- |
Source: Public Records
Mortgage History
| Date | Status | Borrower | Loan Amount |
|---|---|---|---|
| Open | Silva John L | $30,900 | |
| Open | Silva John L | $167,900 | |
| Closed | Silva John L | $31,450 | |
| Previous Owner | Silva John L | $106,000 |
Source: Public Records
Tax History
| Year | Tax Paid | Tax Assessment Tax Assessment Total Assessment is a certain percentage of the fair market value that is determined by local assessors to be the total taxable value of land and additions on the property. | Land | Improvement |
|---|---|---|---|---|
| 2025 | $4,840 | $399,700 | $133,600 | $266,100 |
| 2024 | $4,566 | $379,900 | $133,600 | $246,300 |
| 2023 | $4,303 | $331,500 | $100,600 | $230,900 |
| 2022 | $4,254 | $304,500 | $91,100 | $213,400 |
| 2021 | $4,021 | $277,300 | $75,100 | $202,200 |
| 2020 | $3,892 | $256,900 | $71,100 | $185,800 |
| 2019 | $3,411 | $219,500 | $68,200 | $151,300 |
| 2018 | $3,122 | $194,400 | $68,200 | $126,200 |
| 2017 | $3,062 | $190,200 | $68,200 | $122,000 |
| 2016 | $2,989 | $172,200 | $66,100 | $106,100 |
| 2015 | $2,548 | $140,400 | $66,100 | $74,300 |
| 2014 | $2,555 | $140,900 | $66,100 | $74,800 |
Source: Public Records
Map
Nearby Homes
- 51 Sterling Rd
- 58 Budd Ave
- 18 Massasoit Ave
- 383 Quincy St
- 34 Guild Rd
- 43 Pinehurst Ave
- 2 Dundee St
- 89 Kingman St
- 27 Austin Ct Unit Lot 6
- 11 Russell Rd
- 84 Algonquin St
- 135 Guild Rd
- 149 Moncrief St
- 88 Pinehurst Ave
- 49 Martin St
- 82 Debbie Rd Unit Lot 18
- 45 Perry Ave
- 126 Bates Rd
- 35 Errol Rd
- 129 Anawan St
Your Personal Tour Guide
Ask me questions while you tour the home.