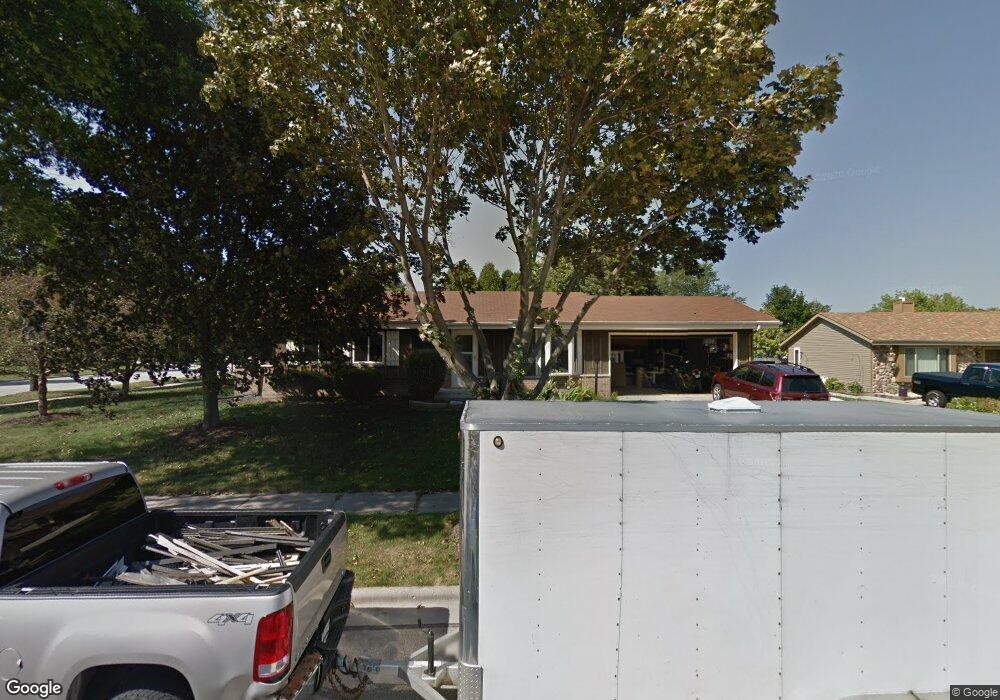
610 Crocus Ct West Bend, WI 53095
Estimated Value: $293,000 - $346,000
3
Beds
2
Baths
1,040
Sq Ft
$316/Sq Ft
Est. Value
About This Home
This home is located at 610 Crocus Ct, West Bend, WI 53095 and is currently estimated at $328,944, approximately $316 per square foot. 610 Crocus Ct is a home located in Washington County with nearby schools including Decorah Elementary School, Badger Middle School, and East High School.
Ownership History
Date
Name
Owned For
Owner Type
Purchase Details
Closed on
Nov 23, 2021
Sold by
Struck Julianne J and Snyder Julianne Janell
Bought by
Struck Anthony J and Struck Julianne J
Current Estimated Value
Home Financials for this Owner
Home Financials are based on the most recent Mortgage that was taken out on this home.
Original Mortgage
$180,000
Outstanding Balance
$163,694
Interest Rate
3.05%
Mortgage Type
VA
Estimated Equity
$165,250
Purchase Details
Closed on
Jun 12, 2015
Sold by
Fischer Donald
Bought by
Snyder Julianne Janell
Purchase Details
Closed on
Jul 29, 2005
Sold by
Saemann Martin R and Saemann Cathleen A
Bought by
Fischer Donald and Mangan Amy
Home Financials for this Owner
Home Financials are based on the most recent Mortgage that was taken out on this home.
Original Mortgage
$128,000
Interest Rate
5.71%
Mortgage Type
New Conventional
Create a Home Valuation Report for This Property
The Home Valuation Report is an in-depth analysis detailing your home's value as well as a comparison with similar homes in the area
Home Values in the Area
Average Home Value in this Area
Purchase History
| Date | Buyer | Sale Price | Title Company |
|---|---|---|---|
| Struck Anthony J | -- | None Available | |
| Snyder Julianne Janell | $155,000 | -- | |
| Fischer Donald | $160,000 | None Available |
Source: Public Records
Mortgage History
| Date | Status | Borrower | Loan Amount |
|---|---|---|---|
| Open | Struck Anthony J | $180,000 | |
| Previous Owner | Fischer Donald | $128,000 |
Source: Public Records
Tax History
| Year | Tax Paid | Tax Assessment Tax Assessment Total Assessment is a certain percentage of the fair market value that is determined by local assessors to be the total taxable value of land and additions on the property. | Land | Improvement |
|---|---|---|---|---|
| 2025 | $3,798 | $167,100 | $39,400 | $127,700 |
| 2024 | $3,494 | $273,600 | $45,900 | $227,700 |
| 2023 | $3,150 | $167,100 | $39,400 | $127,700 |
| 2022 | $2,855 | $167,100 | $39,400 | $127,700 |
| 2021 | $2,919 | $167,100 | $39,400 | $127,700 |
| 2020 | $2,893 | $167,100 | $39,400 | $127,700 |
| 2019 | $2,792 | $167,100 | $39,400 | $127,700 |
| 2018 | $2,715 | $167,100 | $39,400 | $127,700 |
| 2017 | $2,863 | $156,800 | $39,400 | $117,400 |
| 2016 | $2,877 | $156,800 | $39,400 | $117,400 |
| 2015 | $2,966 | $156,800 | $39,400 | $117,400 |
| 2014 | $2,966 | $156,800 | $39,400 | $117,400 |
| 2013 | $3,206 | $156,800 | $39,400 | $117,400 |
Source: Public Records
Map
Nearby Homes
- 1275 Shadowood Cir Unit 110
- 1275 Shadowood Cir Unit 105
- 1325 S Indiana Ave
- 1421 Watercress Cir
- 630 Polaris St
- 1514 Walsh Acres Dr
- 183 Minz Park Cir Unit 2
- 183 Minz Park Cir
- 274 Minz Park Cir Unit 1
- 1422 Goldenrod Cir
- 364 Minz Park Cir Unit 3
- 1117 Anchor Ave
- 1063 Anchor Ave
- 1071 Anchor Ave
- 1711 Cloverview St
- 2600 S Main St
- 2704 S Main St
- 1211 S 5th Ave
- 2575 S Main St
- 734 Creekwood Ln
- 1802 S Indiana Ave
- 1727 S Indiana Ave
- 1815 S Indiana Ave
- 614 Crocus Ct
- 1820 S Indiana Ave
- 613 Crocus Ct
- 601 Lilac Ln
- 1720 S Indiana Ave
- 605 Lilac Ln
- 506 Crocus Ct
- 509 Crocus Ct
- 1823 S Indiana Ave
- 609 Lilac Ln
- 600 Lilac Ln
- 505 Crocus Ct
- 405 Indiana Ct
- 502 Crocus Ct
- 608 Lilac Ln
- 613 Lilac Ln
- 501 Crocus Ct
Your Personal Tour Guide
Ask me questions while you tour the home.