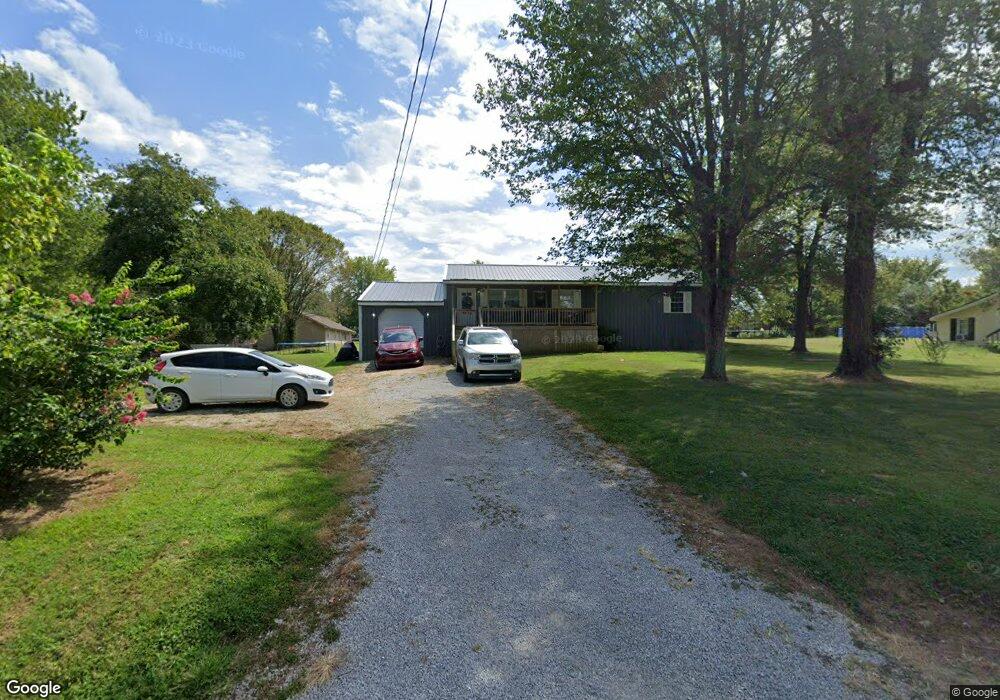
610 Duncan Ln Central City, KY 42330
Estimated Value: $62,000 - $140,000
--
Bed
--
Bath
--
Sq Ft
0.78
Acres
About This Home
This home is located at 610 Duncan Ln, Central City, KY 42330 and is currently estimated at $92,910. 610 Duncan Ln is a home with nearby schools including Muhlenberg County High School.
Ownership History
Date
Name
Owned For
Owner Type
Purchase Details
Closed on
Oct 28, 2019
Sold by
Shemwell Hayward P and Shemwell Taylor A
Bought by
Byrne Brandon S and Byrne Erica
Current Estimated Value
Home Financials for this Owner
Home Financials are based on the most recent Mortgage that was taken out on this home.
Original Mortgage
$104,499
Interest Rate
3.6%
Mortgage Type
Credit Line Revolving
Purchase Details
Closed on
Aug 15, 2017
Sold by
Daniel Gregory and Daniel Amy
Bought by
Byrne Brandon S and Byrne Erica
Home Financials for this Owner
Home Financials are based on the most recent Mortgage that was taken out on this home.
Original Mortgage
$28,000
Interest Rate
3.92%
Mortgage Type
Construction
Create a Home Valuation Report for This Property
The Home Valuation Report is an in-depth analysis detailing your home's value as well as a comparison with similar homes in the area
Home Values in the Area
Average Home Value in this Area
Purchase History
| Date | Buyer | Sale Price | Title Company |
|---|---|---|---|
| Byrne Brandon S | $21,794 | None Available | |
| Byrne Brandon S | $10,000 | None Available |
Source: Public Records
Mortgage History
| Date | Status | Borrower | Loan Amount |
|---|---|---|---|
| Closed | Byrne Brandon S | $104,499 | |
| Previous Owner | Byrne Brandon S | $28,000 |
Source: Public Records
Tax History Compared to Growth
Tax History
| Year | Tax Paid | Tax Assessment Tax Assessment Total Assessment is a certain percentage of the fair market value that is determined by local assessors to be the total taxable value of land and additions on the property. | Land | Improvement |
|---|---|---|---|---|
| 2024 | $328 | $35,000 | $0 | $0 |
| 2023 | $333 | $35,000 | $0 | $0 |
| 2022 | $336 | $35,000 | $0 | $0 |
| 2021 | $343 | $35,000 | $0 | $0 |
| 2020 | $344 | $35,000 | $0 | $0 |
| 2019 | $347 | $35,000 | $3,000 | $32,000 |
| 2018 | $97 | $35,000 | $3,000 | $32,000 |
| 2017 | $75 | $8,000 | $5,000 | $3,000 |
| 2016 | $73 | $8,000 | $3,000 | $5,000 |
| 2012 | -- | $34,000 | $8,000 | $26,000 |
Source: Public Records
Map
Nearby Homes