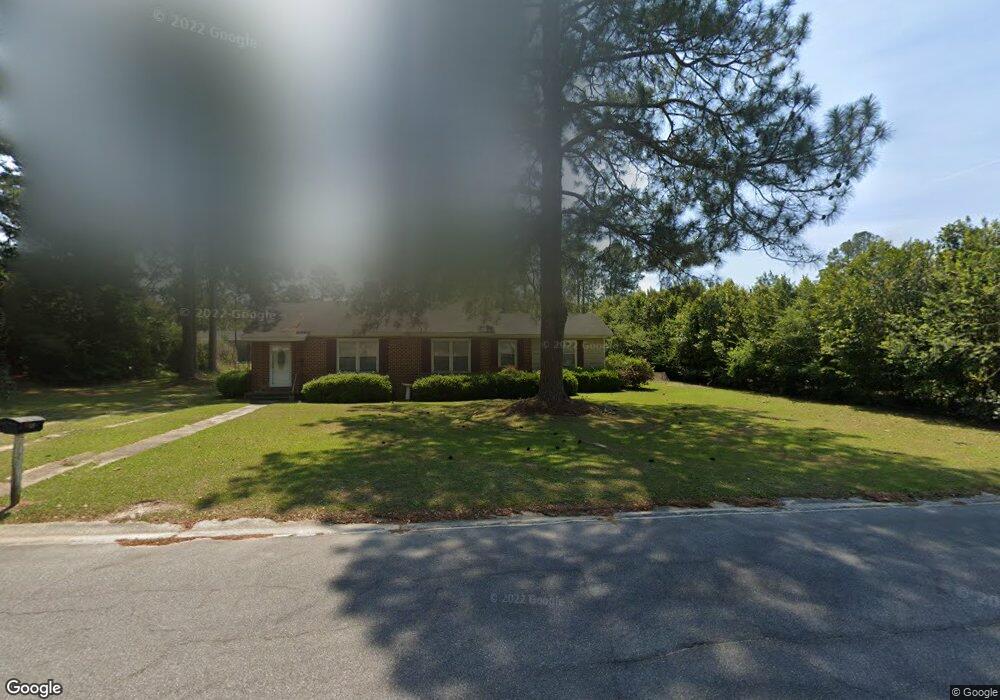
610 E 17th Ave Cordele, GA 31015
Estimated Value: $107,000 - $167,105
3
Beds
2
Baths
1,995
Sq Ft
$71/Sq Ft
Est. Value
About This Home
This home is located at 610 E 17th Ave, Cordele, GA 31015 and is currently estimated at $141,276, approximately $70 per square foot. 610 E 17th Ave is a home located in Crisp County with nearby schools including Crisp County Elementary School, Crisp County Primary School, and Crisp County Middle School.
Ownership History
Date
Name
Owned For
Owner Type
Purchase Details
Closed on
Mar 17, 2017
Bought by
James Atkins
Current Estimated Value
Home Financials for this Owner
Home Financials are based on the most recent Mortgage that was taken out on this home.
Original Mortgage
$30,597
Outstanding Balance
$15,607
Interest Rate
4.15%
Mortgage Type
Unknown
Estimated Equity
$125,669
Purchase Details
Closed on
May 10, 2016
Sold by
Ditech Financial Llc
Bought by
Sec Of Veterans Affairs
Purchase Details
Closed on
Apr 5, 2016
Sold by
Brown Eddie E
Bought by
Ditech Financial
Purchase Details
Closed on
Jan 22, 2003
Sold by
Brown Eddie E
Bought by
Brown Eddie E and Brown Melinda F
Purchase Details
Closed on
Jun 29, 2000
Sold by
Olds Willie E and Olds Bren
Bought by
Brown Eddie E
Purchase Details
Closed on
Jan 4, 1983
Sold by
Crum Charles A
Bought by
Olds Willie E and Olds Bren
Purchase Details
Closed on
Oct 4, 1949
Sold by
Patterson E H
Bought by
Crum Charles A
Create a Home Valuation Report for This Property
The Home Valuation Report is an in-depth analysis detailing your home's value as well as a comparison with similar homes in the area
Home Values in the Area
Average Home Value in this Area
Purchase History
| Date | Buyer | Sale Price | Title Company |
|---|---|---|---|
| James Atkins | -- | -- | |
| Sec Of Veterans Affairs | $63,878 | -- | |
| Ditech Financial | $63,787 | -- | |
| Brown Eddie E | -- | -- | |
| Brown Eddie E | $65,000 | -- | |
| Olds Willie E | $50,000 | -- | |
| Crum Charles A | -- | -- | |
| Patterson Nellie T | -- | -- |
Source: Public Records
Mortgage History
| Date | Status | Borrower | Loan Amount |
|---|---|---|---|
| Open | James Atkins | $30,597 |
Source: Public Records
Tax History Compared to Growth
Tax History
| Year | Tax Paid | Tax Assessment Tax Assessment Total Assessment is a certain percentage of the fair market value that is determined by local assessors to be the total taxable value of land and additions on the property. | Land | Improvement |
|---|---|---|---|---|
| 2024 | $1,760 | $49,101 | $5,570 | $43,531 |
| 2023 | $1,644 | $43,858 | $2,785 | $41,073 |
| 2022 | $1,094 | $41,400 | $2,785 | $38,615 |
| 2021 | $1,072 | $38,943 | $2,785 | $36,158 |
| 2020 | $1,096 | $38,943 | $2,785 | $36,158 |
| 2019 | $1,105 | $38,943 | $2,785 | $36,158 |
| 2018 | $1,004 | $34,056 | $5,292 | $28,764 |
| 2017 | $1,383 | $34,056 | $5,292 | $28,764 |
| 2016 | $948 | $34,056 | $5,292 | $28,764 |
| 2015 | -- | $34,056 | $5,292 | $28,764 |
| 2014 | -- | $34,056 | $5,292 | $28,764 |
| 2013 | -- | $34,056 | $5,292 | $28,764 |
Source: Public Records
Map
Nearby Homes