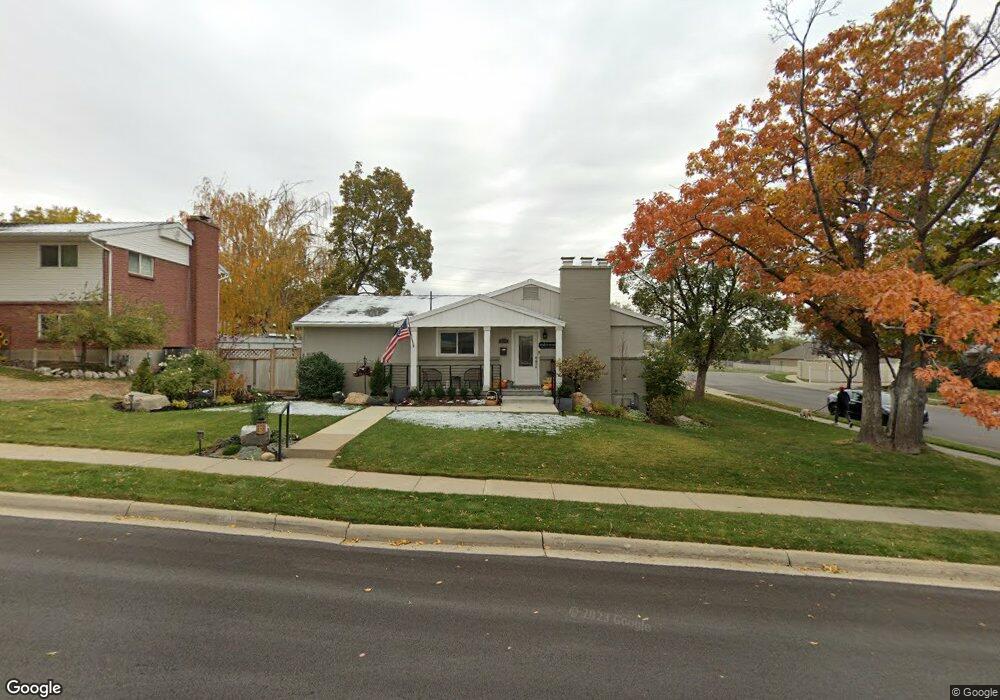
610 E 650 N Bountiful, UT 84010
Estimated Value: $568,000 - $702,000
5
Beds
4
Baths
2,688
Sq Ft
$231/Sq Ft
Est. Value
About This Home
This home is located at 610 E 650 N, Bountiful, UT 84010 and is currently estimated at $621,786, approximately $231 per square foot. 610 E 650 N is a home located in Davis County with nearby schools including Tolman School, Bountiful Junior High School, and Bountiful High School.
Ownership History
Date
Name
Owned For
Owner Type
Purchase Details
Closed on
Sep 30, 2004
Sold by
Mongrain Gary Albert and Mongrain Elizabeth
Bought by
Mongrain Gary Albert and Mongrain Elzabeth Nelson
Current Estimated Value
Purchase Details
Closed on
Dec 19, 2002
Sold by
Mongrain Elizabeth N
Bought by
Mongrain Gary A and Mongrain Elizabeth N
Purchase Details
Closed on
Jul 30, 2001
Sold by
Nelson Rolf A and Nelson Sylvia A
Bought by
Nelson Gary and Mongrain Elizabeth
Create a Home Valuation Report for This Property
The Home Valuation Report is an in-depth analysis detailing your home's value as well as a comparison with similar homes in the area
Purchase History
| Date | Buyer | Sale Price | Title Company |
|---|---|---|---|
| Mongrain Gary Albert | -- | -- | |
| Mongrain Gary A | -- | Equity Title Agency | |
| Mongrain Elizabeth N | -- | Equity Title Agency | |
| Nelson Gary | -- | Equity Title Agency |
Source: Public Records
Tax History
| Year | Tax Paid | Tax Assessment Tax Assessment Total Assessment is a certain percentage of the fair market value that is determined by local assessors to be the total taxable value of land and additions on the property. | Land | Improvement |
|---|---|---|---|---|
| 2025 | $520 | $305,800 | $123,591 | $182,209 |
| 2024 | $416 | $297,550 | $114,006 | $183,544 |
| 2023 | $3,006 | $516,000 | $205,997 | $310,003 |
| 2022 | $3,194 | $301,400 | $109,592 | $191,808 |
| 2021 | $536 | $426,000 | $162,824 | $263,176 |
| 2020 | $2,684 | $390,000 | $148,276 | $241,724 |
| 2019 | $2,533 | $358,000 | $147,658 | $210,342 |
| 2018 | $2,359 | $328,000 | $136,948 | $191,052 |
| 2016 | $1,985 | $149,160 | $43,088 | $106,072 |
| 2015 | $1,678 | $116,325 | $43,088 | $73,237 |
| 2014 | $1,664 | $120,190 | $43,088 | $77,102 |
| 2013 | -- | $97,447 | $41,748 | $55,699 |
Source: Public Records
Map
Nearby Homes
Your Personal Tour Guide
Ask me questions while you tour the home.