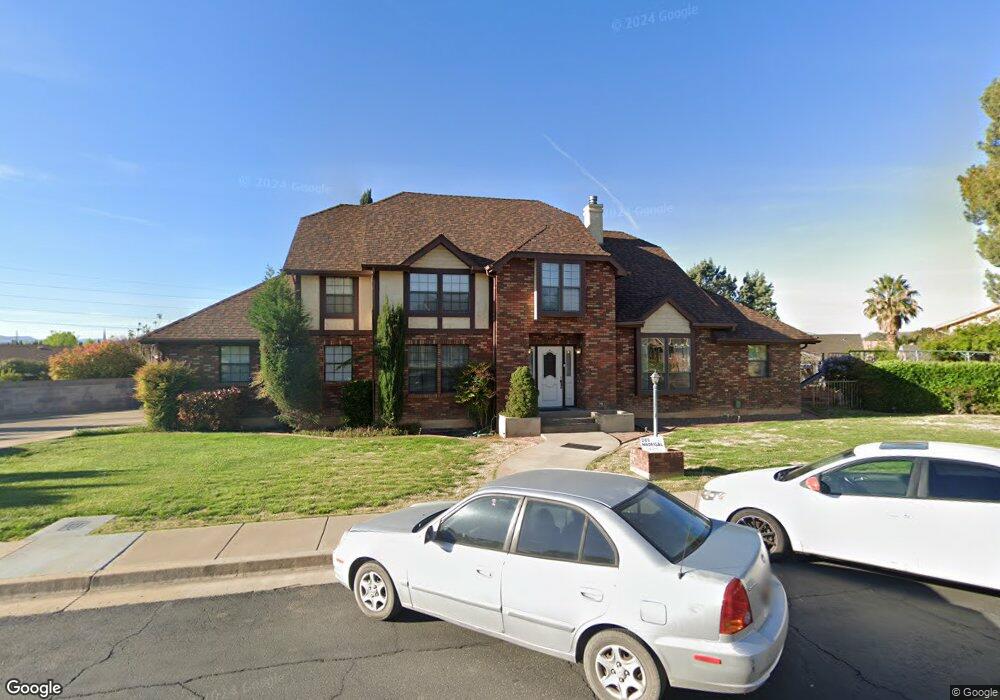
610 E 760 Cir S St. George, UT 84770
Estimated Value: $585,000 - $697,000
6
Beds
3
Baths
4,509
Sq Ft
$143/Sq Ft
Est. Value
About This Home
This home is located at 610 E 760 Cir S, St. George, UT 84770 and is currently estimated at $645,597, approximately $143 per square foot. 610 E 760 Cir S is a home located in Washington County with nearby schools including Legacy School, Dixie Middle School, and Tonaquint Intermediate School.
Ownership History
Date
Name
Owned For
Owner Type
Purchase Details
Closed on
Jan 29, 2025
Sold by
Richmond Kathryn
Bought by
Frank Stuart Richmond And Kathryn Ann Richmon and Richmond
Current Estimated Value
Home Financials for this Owner
Home Financials are based on the most recent Mortgage that was taken out on this home.
Original Mortgage
$156,000
Outstanding Balance
$155,038
Interest Rate
6.72%
Mortgage Type
New Conventional
Estimated Equity
$490,559
Purchase Details
Closed on
Oct 26, 2020
Sold by
Richmond Frank S and Richmond Kathryn A
Bought by
Richmond Frank Stuart and Richmond Kathryn Ann
Home Financials for this Owner
Home Financials are based on the most recent Mortgage that was taken out on this home.
Original Mortgage
$155,000
Interest Rate
2.8%
Mortgage Type
New Conventional
Create a Home Valuation Report for This Property
The Home Valuation Report is an in-depth analysis detailing your home's value as well as a comparison with similar homes in the area
Purchase History
| Date | Buyer | Sale Price | Title Company |
|---|---|---|---|
| Frank Stuart Richmond And Kathryn Ann Richmon | -- | Trident Title | |
| Richmond Kathryn | -- | Trident Title | |
| Richmond Frank Stuart | -- | First American Title Ins Co | |
| Richmond Frank S | -- | First American Title Ins Co |
Source: Public Records
Mortgage History
| Date | Status | Borrower | Loan Amount |
|---|---|---|---|
| Open | Richmond Kathryn | $156,000 | |
| Previous Owner | Richmond Frank S | $155,000 |
Source: Public Records
Tax History
| Year | Tax Paid | Tax Assessment Tax Assessment Total Assessment is a certain percentage of the fair market value that is determined by local assessors to be the total taxable value of land and additions on the property. | Land | Improvement |
|---|---|---|---|---|
| 2025 | $2,252 | $346,005 | $69,300 | $276,705 |
| 2024 | $2,343 | $331,375 | $57,750 | $273,625 |
| 2023 | $2,343 | $350,130 | $49,115 | $301,015 |
| 2022 | $2,653 | $372,735 | $49,115 | $323,620 |
| 2021 | $2,210 | $463,100 | $85,000 | $378,100 |
| 2020 | $2,042 | $402,900 | $70,000 | $332,900 |
| 2019 | $2,044 | $394,100 | $70,000 | $324,100 |
| 2018 | $1,989 | $192,225 | $0 | $0 |
| 2017 | $2,007 | $193,930 | $0 | $0 |
| 2016 | $1,986 | $177,485 | $0 | $0 |
| 2015 | $2,006 | $171,985 | $0 | $0 |
| 2014 | $1,983 | $171,160 | $0 | $0 |
Source: Public Records
Map
Nearby Homes
- 701 E 900 S Unit 33
- 670 E 900 S
- 464 E 700 S
- 665 S 500 E
- 777 S 400 E Unit 45
- 443 E 700 S
- 608 E 1010 S
- 660 S 400 E Unit 4
- 840 S 400 E Unit 58
- 840 S 400 E Unit 46
- 840 S 400 E Unit 46
- 459 S 500 E
- 251 E 700 S
- 1019 S 900 E
- 380 S 500 E
- 970 E 700 S Unit 79
- 970 E 700 S Unit 12
- 1040 E 900 S Unit 16
- 1063 E 600 S Unit 10
- 441 Sunland Dr Unit 25
- 610 E 760 South Cir
- 623 Concord Way
- 807 S 600 Cir E
- 807 S 600 East Cir
- 615 Concord Way
- 598 E 760 South Cir
- 630 E 760 South Cir
- 630 E 760 Cir S
- 758 S Lexington
- 803 S 600 Cir E
- 758 Lexington Dr
- 578 Cambridge Dr
- 821 S 600 Cir E
- 607 E 760 South Cir
- 643 Concord Way
- 821 S 600 East Cir
- 803 S 600 East Cir
- 751 Cambridge Dr
- 566 Cambridge Dr
- 610 Lexington Dr
Your Personal Tour Guide
Ask me questions while you tour the home.