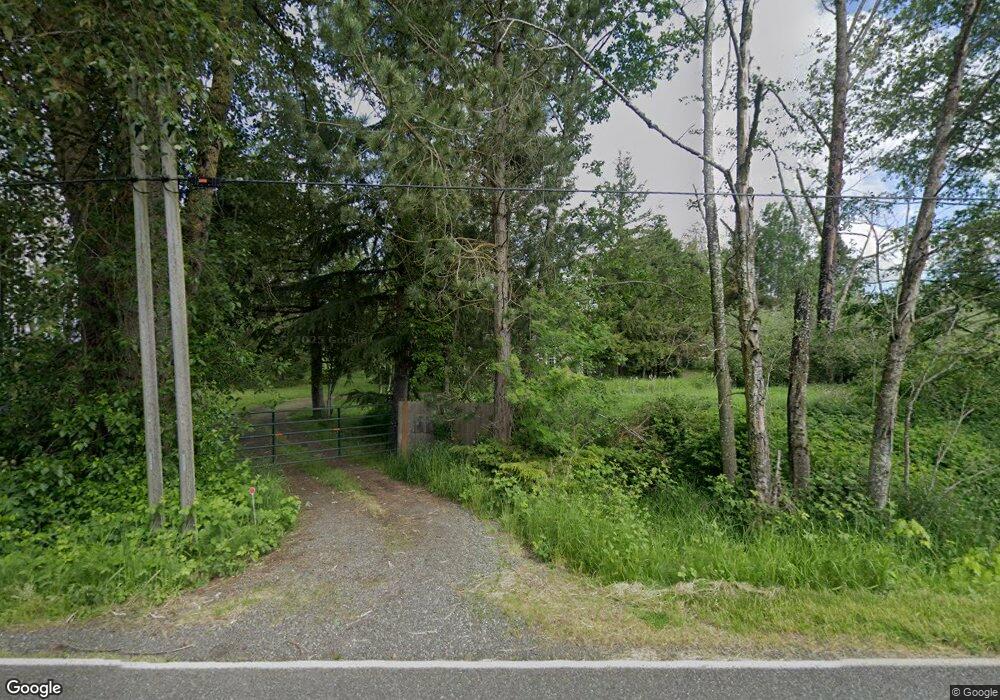
610 E Hemmi Rd Lynden, WA 98264
Estimated Value: $832,934 - $874,000
2
Beds
1
Bath
3,719
Sq Ft
$231/Sq Ft
Est. Value
About This Home
This home is located at 610 E Hemmi Rd, Lynden, WA 98264 and is currently estimated at $859,984, approximately $231 per square foot. 610 E Hemmi Rd is a home located in Whatcom County with nearby schools including Irene Reither Elementary School, Meridian Middle School, and Meridian High School.
Ownership History
Date
Name
Owned For
Owner Type
Purchase Details
Closed on
Feb 14, 2018
Sold by
Mazkoor Vedad
Bought by
Mazkoori Vedad and Theophilus Lee
Current Estimated Value
Purchase Details
Closed on
Feb 28, 2011
Sold by
Theophilus Lee and Mazkoori Vedad
Bought by
Mazkoori Vedad
Purchase Details
Closed on
Dec 7, 2004
Sold by
Theophilus Lee
Bought by
Theophilus Lee and Mazkoori Vedad
Home Financials for this Owner
Home Financials are based on the most recent Mortgage that was taken out on this home.
Original Mortgage
$202,500
Interest Rate
5.64%
Mortgage Type
New Conventional
Purchase Details
Closed on
Jun 13, 2001
Sold by
Mazkoori Vedad
Bought by
Theophilus Lee
Home Financials for this Owner
Home Financials are based on the most recent Mortgage that was taken out on this home.
Original Mortgage
$134,400
Interest Rate
7.14%
Create a Home Valuation Report for This Property
The Home Valuation Report is an in-depth analysis detailing your home's value as well as a comparison with similar homes in the area
Home Values in the Area
Average Home Value in this Area
Purchase History
| Date | Buyer | Sale Price | Title Company |
|---|---|---|---|
| Mazkoori Vedad | -- | None Available | |
| Mazkoori Vedad | -- | None Available | |
| Theophilus Lee | -- | Stewart Title Company | |
| Theophilus Lee | -- | First American Title Insuran | |
| Theophilus Lee | $121,626 | First American Title Insuran |
Source: Public Records
Mortgage History
| Date | Status | Borrower | Loan Amount |
|---|---|---|---|
| Previous Owner | Theophilus Lee | $202,500 | |
| Previous Owner | Theophilus Lee | $134,400 |
Source: Public Records
Tax History Compared to Growth
Tax History
| Year | Tax Paid | Tax Assessment Tax Assessment Total Assessment is a certain percentage of the fair market value that is determined by local assessors to be the total taxable value of land and additions on the property. | Land | Improvement |
|---|---|---|---|---|
| 2024 | $5,316 | $689,102 | $310,594 | $378,508 |
| 2023 | $5,316 | $684,150 | $320,200 | $363,950 |
| 2022 | $3,976 | $499,021 | $216,965 | $282,056 |
| 2021 | $3,849 | $396,047 | $172,194 | $223,853 |
| 2020 | $3,382 | $350,481 | $152,382 | $198,099 |
| 2019 | $2,780 | $308,796 | $134,259 | $174,537 |
| 2018 | $3,235 | $277,574 | $120,684 | $156,890 |
| 2017 | $3,220 | $245,641 | $106,800 | $138,841 |
| 2016 | $3,175 | $258,978 | $102,501 | $156,477 |
| 2015 | $3,183 | $254,205 | $100,612 | $153,593 |
| 2014 | -- | $247,234 | $97,853 | $149,381 |
| 2013 | -- | $238,712 | $94,480 | $144,232 |
Source: Public Records
Map
Nearby Homes
- 720 Denali Ct
- 210 E Hemmi Rd
- 740 Denali Ct
- 5707 Denali Ln
- 725 Denali Ct
- 731 Denali Ct
- 5750 Denali Ln
- 739 Denali Ct
- 5720 Denali Ln
- 5956 Guide Meridian
- 351 W Silverado Ct
- 353 E Silverado Ct
- 6732 La Bello Dr
- 6037 Old Guide Rd
- 562 E Smith Rd
- 1383 Ten Mile Rd
- 6864 Blumefield Dr
- 918 Citadel Dr
- 504 E Smith Rd
- 858 E Smith Rd
- 639 E Hemmi Rd
- 611 E Hemmi Rd
- 628 E Hemmi Rd
- 660 E Hemmi Rd
- 6150 Chasteen Rd
- 6121 Medcalf Rd
- 554 E Hemmi Rd
- 6047 Medcalf Rd
- 6049 Medcalf Rd
- 595 E Hemmi Rd
- 563 E Hemmi Rd
- 591 E Hemmi Rd
- 557 E Hemmi Rd
- 555 E Hemmi Rd
- 551 E Hemmi Rd
- 535 E Hemmi Rd
- 505 E Hemmi Rd
- 515 E Hemmi Rd
- 6063 Medcalf Rd
- 6179 Medcalf Rd