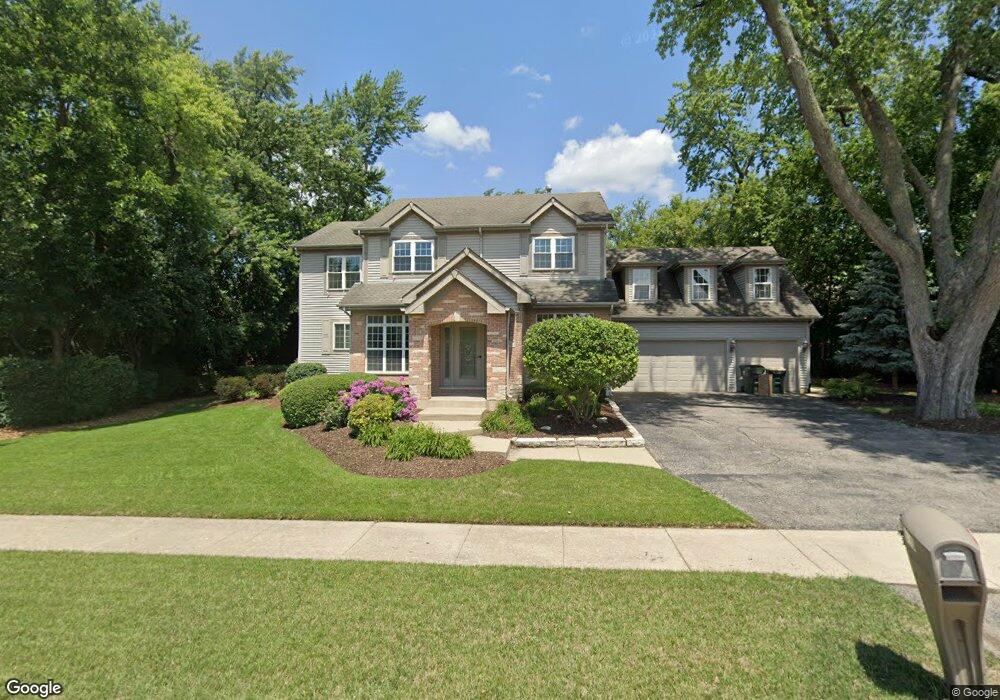
610 E Hintz Rd Arlington Heights, IL 60004
Estimated Value: $701,000 - $884,000
4
Beds
4
Baths
3,200
Sq Ft
$238/Sq Ft
Est. Value
About This Home
This home is located at 610 E Hintz Rd, Arlington Heights, IL 60004 and is currently estimated at $762,238, approximately $238 per square foot. 610 E Hintz Rd is a home located in Cook County with nearby schools including J.W. Riley Elementary School, Jack London Middle School, and Buffalo Grove High School.
Ownership History
Date
Name
Owned For
Owner Type
Purchase Details
Closed on
Dec 9, 2008
Sold by
Anderson Craig
Bought by
Anderson Craig S and Craig S Anderson Revocable Trust
Current Estimated Value
Purchase Details
Closed on
Dec 17, 1998
Sold by
Brien John M and Brien Chris
Bought by
Anderson Craig
Home Financials for this Owner
Home Financials are based on the most recent Mortgage that was taken out on this home.
Original Mortgage
$129,600
Outstanding Balance
$29,464
Interest Rate
6.79%
Estimated Equity
$732,774
Purchase Details
Closed on
Aug 26, 1997
Sold by
Swenson Michael D and Swenson Jan C
Bought by
Brien John
Home Financials for this Owner
Home Financials are based on the most recent Mortgage that was taken out on this home.
Original Mortgage
$127,800
Interest Rate
7.54%
Purchase Details
Closed on
Feb 6, 1995
Sold by
Hoatlin Norma K and Devos Charlotte Algie
Bought by
Swenson Michael D and Swenson Jan C
Home Financials for this Owner
Home Financials are based on the most recent Mortgage that was taken out on this home.
Original Mortgage
$108,350
Interest Rate
9.13%
Create a Home Valuation Report for This Property
The Home Valuation Report is an in-depth analysis detailing your home's value as well as a comparison with similar homes in the area
Home Values in the Area
Average Home Value in this Area
Purchase History
| Date | Buyer | Sale Price | Title Company |
|---|---|---|---|
| Anderson Craig S | -- | None Available | |
| Anderson Craig | $162,000 | Lawyers Title Insurance Corp | |
| Brien John | $94,666 | -- | |
| Swenson Michael D | $144,500 | -- |
Source: Public Records
Mortgage History
| Date | Status | Borrower | Loan Amount |
|---|---|---|---|
| Open | Anderson Craig | $129,600 | |
| Previous Owner | Brien John | $127,800 | |
| Previous Owner | Swenson Michael D | $108,350 |
Source: Public Records
Tax History Compared to Growth
Tax History
| Year | Tax Paid | Tax Assessment Tax Assessment Total Assessment is a certain percentage of the fair market value that is determined by local assessors to be the total taxable value of land and additions on the property. | Land | Improvement |
|---|---|---|---|---|
| 2024 | $16,297 | $52,000 | $9,065 | $42,935 |
| 2023 | $15,532 | $52,000 | $9,065 | $42,935 |
| 2022 | $15,532 | $52,000 | $9,065 | $42,935 |
| 2021 | $15,475 | $44,734 | $6,345 | $38,389 |
| 2020 | $15,063 | $44,734 | $6,345 | $38,389 |
| 2019 | $15,145 | $49,705 | $6,345 | $43,360 |
| 2018 | $14,949 | $43,954 | $5,439 | $38,515 |
| 2017 | $16,937 | $50,733 | $5,439 | $45,294 |
| 2016 | $15,838 | $50,733 | $5,439 | $45,294 |
| 2015 | $15,412 | $48,039 | $4,532 | $43,507 |
| 2014 | $15,205 | $48,039 | $4,532 | $43,507 |
| 2013 | $14,118 | $48,039 | $4,532 | $43,507 |
Source: Public Records
Map
Nearby Homes
- 504 E Sunset Dr
- 2620 N Windsor Dr Unit 201
- 2604 N Windsor Dr Unit 206
- 2640 N Windsor Dr Unit 102
- 2632 N Windsor Dr Unit 104
- 1306 E Best Dr
- 2315 N Arlington Heights Rd
- 3023 N Windsor Dr
- 3157 N Daniels Ct Unit 1502
- 215 W Hintz Rd
- 2522 N Chestnut Ave
- 2608 N Wilshire Ln
- 1225 Radcliffe Rd Unit 2
- 1127 Miller Ln Unit 107
- 972 Thornton Ln Unit 102
- 2100 N Ridge Rd
- 3222 N Heritage Ln
- 1115 Miller Ln Unit 104
- 3227 N Heritage Ln
- 3300 N Carriageway Dr Unit 317
- 2707 N Vista Rd
- 616 E Hintz Rd
- 2717 N Vista Rd
- 704 E Hintz Rd
- 2727 N Vista Rd
- 2661 N Douglas Ave
- 2665 N Bradford Dr
- 2655 N Douglas Ave
- 710 E Hintz Rd
- 2710 N Vista Rd
- 2731 N Vista Rd
- 2661 N Bradford Dr
- 711 E Hintz Rd
- 2649 N Douglas Ave
- 2660 N Douglas Ave
- 2722 N Vista Rd
- 715 E Hintz Rd
- 716 E Hintz Rd
- 2657 N Bradford Dr Unit 1
- 2654 N Douglas Ave