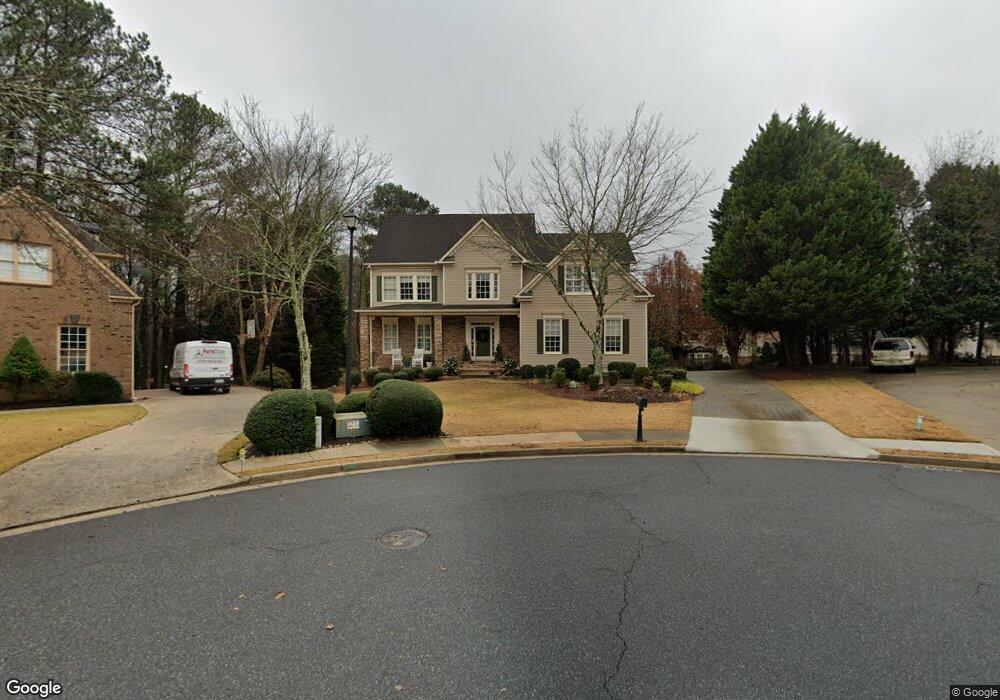
610 Fawn Run Alpharetta, GA 30005
Estimated Value: $837,000 - $985,000
5
Beds
4
Baths
2,959
Sq Ft
$303/Sq Ft
Est. Value
About This Home
This home is located at 610 Fawn Run, Alpharetta, GA 30005 and is currently estimated at $896,064, approximately $302 per square foot. 610 Fawn Run is a home located in Forsyth County with nearby schools including Brookwood Elementary School, South Forsyth Middle School, and Lambert High School.
Ownership History
Date
Name
Owned For
Owner Type
Purchase Details
Closed on
Jun 24, 2004
Sold by
Stephen Bradley G
Bought by
Stephen Bradley G and Stephen Linda
Current Estimated Value
Home Financials for this Owner
Home Financials are based on the most recent Mortgage that was taken out on this home.
Original Mortgage
$38,000
Interest Rate
6.25%
Mortgage Type
New Conventional
Purchase Details
Closed on
Jul 23, 1999
Sold by
Owen James G
Bought by
Sexton Daniel L Mary J
Home Financials for this Owner
Home Financials are based on the most recent Mortgage that was taken out on this home.
Original Mortgage
$185,000
Interest Rate
7.66%
Mortgage Type
New Conventional
Purchase Details
Closed on
Aug 18, 1995
Sold by
D R Horton Inc
Bought by
Owen James
Create a Home Valuation Report for This Property
The Home Valuation Report is an in-depth analysis detailing your home's value as well as a comparison with similar homes in the area
Home Values in the Area
Average Home Value in this Area
Purchase History
| Date | Buyer | Sale Price | Title Company |
|---|---|---|---|
| Stephen Bradley G | -- | -- | |
| Stephen Bradley G | $380,000 | -- | |
| Sirva Relocation Llc | $380,000 | -- | |
| Sexton Daniel L Mary J | $265,000 | -- | |
| Owen James | $239,000 | -- |
Source: Public Records
Mortgage History
| Date | Status | Borrower | Loan Amount |
|---|---|---|---|
| Closed | Sirva Relocation Llc | $38,000 | |
| Open | Sirva Relocation Llc | $304,000 | |
| Previous Owner | Sexton Daniel L Mary J | $185,000 | |
| Closed | Owen James | $0 |
Source: Public Records
Tax History Compared to Growth
Tax History
| Year | Tax Paid | Tax Assessment Tax Assessment Total Assessment is a certain percentage of the fair market value that is determined by local assessors to be the total taxable value of land and additions on the property. | Land | Improvement |
|---|---|---|---|---|
| 2025 | $6,251 | $376,376 | $78,000 | $298,376 |
| 2024 | $6,251 | $320,928 | $68,000 | $252,928 |
| 2023 | $5,798 | $312,236 | $60,000 | $252,236 |
| 2022 | $5,574 | $207,356 | $50,000 | $157,356 |
| 2021 | $4,966 | $207,356 | $50,000 | $157,356 |
| 2020 | $4,788 | $198,780 | $50,000 | $148,780 |
| 2019 | $4,770 | $197,488 | $50,000 | $147,488 |
| 2018 | $4,712 | $193,192 | $50,000 | $143,192 |
| 2017 | $4,504 | $182,424 | $40,000 | $142,424 |
| 2016 | $4,065 | $161,664 | $30,000 | $131,664 |
| 2015 | $3,847 | $150,984 | $30,000 | $120,984 |
| 2014 | $3,143 | $125,732 | $30,000 | $95,732 |
Source: Public Records
Map
Nearby Homes
- 7260 Fawn Lake Dr
- 7335 Lytham Trace
- 11915 Carriage Park Ln
- 595 Barsham Way
- 11800 Carriage Park Ln
- 7045 Harlech Trace
- 5105 Deerlake Dr
- 3845 Bridle Creek Dr
- 7170 Collingsworth Place
- 3820 Ridge Point Dr
- 4165 Hammond Bridge Dr
- 110 W Meadows Ct
- 7105 Brookwood Way
- 4150 Cedar Bridge Walk
- 4020 Bridle Ridge Dr
- 230 Sessingham Ln
- 3730 Lakeheath Dr
- 3715 Lakeheath Dr
- 3415 Fox Hollow Way
- 3585 Lakeheath Dr
- 600 Fawn Run
- 940 Whitetail Ct
- 595 Fawn Run Unit 2A
- 585 Fawn Run Unit IIA
- 930 Whitetail Ct
- 590 Fawn Run
- 975 Whitetail Ct
- 575 Fawn Run
- 580 Fawn Run
- 7220 Fawn Lake Dr Unit 11B
- 920 Whitetail Ct Unit IIC
- 7210 Fawn Lake Dr
- 965 Whitetail Ct
- 7230 Fawn Lake Dr
- 565 Fawn Run
- 7200 Fawn Lake Dr
- 910 Whitetail Ct
- 955 Whitetail Ct
- 570 Fawn Run
- 7240 Fawn Lake Dr