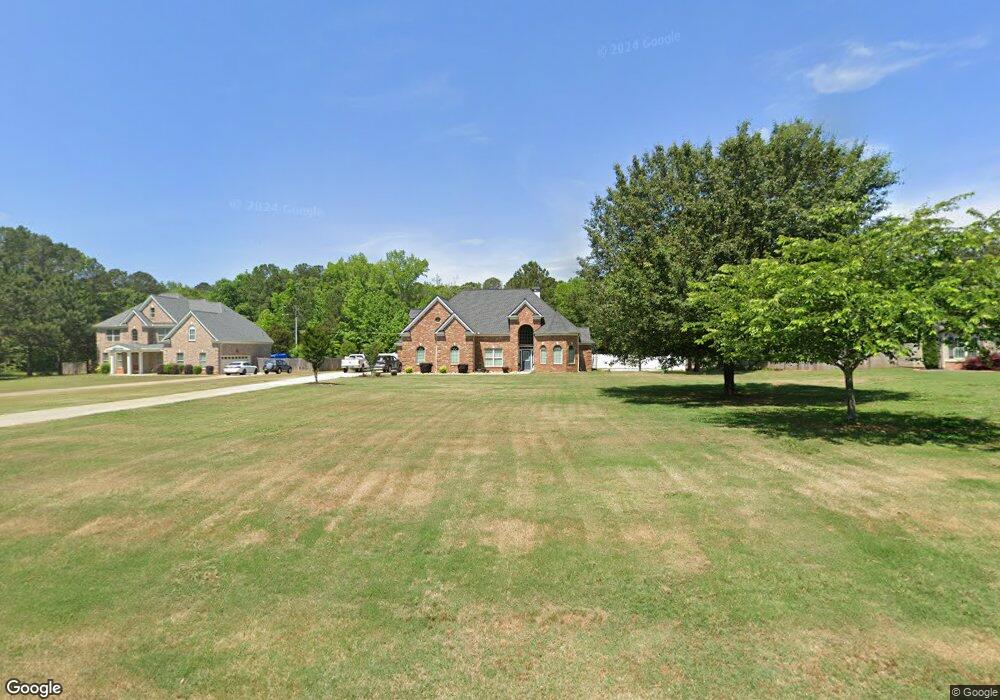
610 Hope Way Fayetteville, GA 30215
Estimated Value: $530,000 - $625,000
4
Beds
3
Baths
3,058
Sq Ft
$183/Sq Ft
Est. Value
About This Home
This home is located at 610 Hope Way, Fayetteville, GA 30215 and is currently estimated at $558,403, approximately $182 per square foot. 610 Hope Way is a home located in Fayette County with nearby schools including Sara Harp Minter Elementary School, Whitewater Middle School, and Whitewater High School.
Ownership History
Date
Name
Owned For
Owner Type
Purchase Details
Closed on
Aug 7, 2024
Sold by
Mathis Glenn B
Bought by
Mathis Tonya M
Current Estimated Value
Purchase Details
Closed on
May 21, 2010
Sold by
Regions Bk
Bought by
Mathis Glenn B and Mathis Tonya M
Home Financials for this Owner
Home Financials are based on the most recent Mortgage that was taken out on this home.
Original Mortgage
$248,224
Interest Rate
5.02%
Mortgage Type
VA
Purchase Details
Closed on
Dec 1, 2009
Sold by
Smith Paul
Bought by
Regions Bk
Purchase Details
Closed on
Oct 14, 2008
Sold by
Dream Home Developers Llc
Bought by
Smith Paul
Home Financials for this Owner
Home Financials are based on the most recent Mortgage that was taken out on this home.
Original Mortgage
$331,200
Interest Rate
6.34%
Mortgage Type
New Conventional
Create a Home Valuation Report for This Property
The Home Valuation Report is an in-depth analysis detailing your home's value as well as a comparison with similar homes in the area
Home Values in the Area
Average Home Value in this Area
Purchase History
| Date | Buyer | Sale Price | Title Company |
|---|---|---|---|
| Mathis Tonya M | -- | None Listed On Document | |
| Mathis Glenn B | $243,000 | -- | |
| Regions Bk | $361,273 | -- | |
| Smith Paul | $414,000 | -- |
Source: Public Records
Mortgage History
| Date | Status | Borrower | Loan Amount |
|---|---|---|---|
| Previous Owner | Mathis Glenn B | $248,224 | |
| Previous Owner | Smith Paul | $331,200 |
Source: Public Records
Tax History Compared to Growth
Tax History
| Year | Tax Paid | Tax Assessment Tax Assessment Total Assessment is a certain percentage of the fair market value that is determined by local assessors to be the total taxable value of land and additions on the property. | Land | Improvement |
|---|---|---|---|---|
| 2024 | $4,522 | $217,132 | $19,200 | $197,932 |
| 2023 | $4,114 | $207,480 | $19,200 | $188,280 |
| 2022 | $4,284 | $188,600 | $19,200 | $169,400 |
| 2021 | $4,016 | $160,120 | $19,200 | $140,920 |
| 2020 | $4,200 | $150,960 | $19,200 | $131,760 |
| 2019 | $4,073 | $144,920 | $19,200 | $125,720 |
| 2018 | $3,850 | $135,600 | $19,200 | $116,400 |
| 2017 | $3,734 | $131,080 | $19,200 | $111,880 |
| 2016 | $3,419 | $117,680 | $19,200 | $98,480 |
| 2015 | $3,184 | $107,840 | $19,200 | $88,640 |
| 2014 | $2,964 | $98,760 | $19,200 | $79,560 |
| 2013 | -- | $97,240 | $0 | $0 |
Source: Public Records
Map
Nearby Homes
- 994 Highway 85 S
- 375 Plainfield St
- 430 Plainfield St
- 180 Plainfield St
- 145 Majesty Ln
- 315 Royal Ridge Way
- 100 Queens Gate
- 100 Parliament Ct
- 220 Essex Cir
- 110 Lindsey Terrace
- 100 Kingswood Way
- LOT 2 SOUTH OF Redwine Rd Unit LOT 2 SOUTH OF 1585
- 100 Amberton Ln
- 105 Roxbrough Ln Unit 7A
- 110 Mourning Dove Dr S
- 175 Kingswood Dr
- 175 Keaton Dr
- 110 Greenway Ct
- 100 Cherokee Place
- 170 Woodstream Way Unit B
- 600 Hope Way
- 320 Hope Way Unit LOT 3
- 620 Hope Way
- 0 Tributary Way Unit 3175811
- 615 Hope Way
- 615 Hope Way Unit 11
- 193 Price Rd
- 0 Corner Tributary Way & Price Rd Unit 20024486
- 0 Corner Tributary Way & Price Rd Unit 6956806
- 0 Corner Tributary Way & Price Rd Unit 9072123
- 630 Hope Way Unit LOT 4
- 630 Hope Way
- 475 Plainfield St
- 605 Hope Way Unit 12
- 605 Hope Way
- 640 Hope Way Unit LOT 5
- 640 Hope Way
- 625 Hope Way
- 625 Hope Way Unit 10
- 625 Hope Way Unit 625